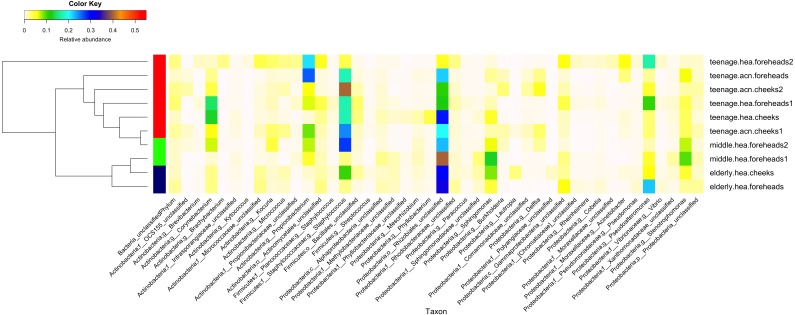
Figure 2. Diversity and relative abundances of bacterial community compositions (as GLOTU) among the 10 subgroups.
Subgroups are clustered by dendrogram computed with Morisita-Horn dissimilarity indices: teenage (red), middle-aged (green) and elderly (navy). Bacterial genera of <0.05% relative abundance are not displayed.

