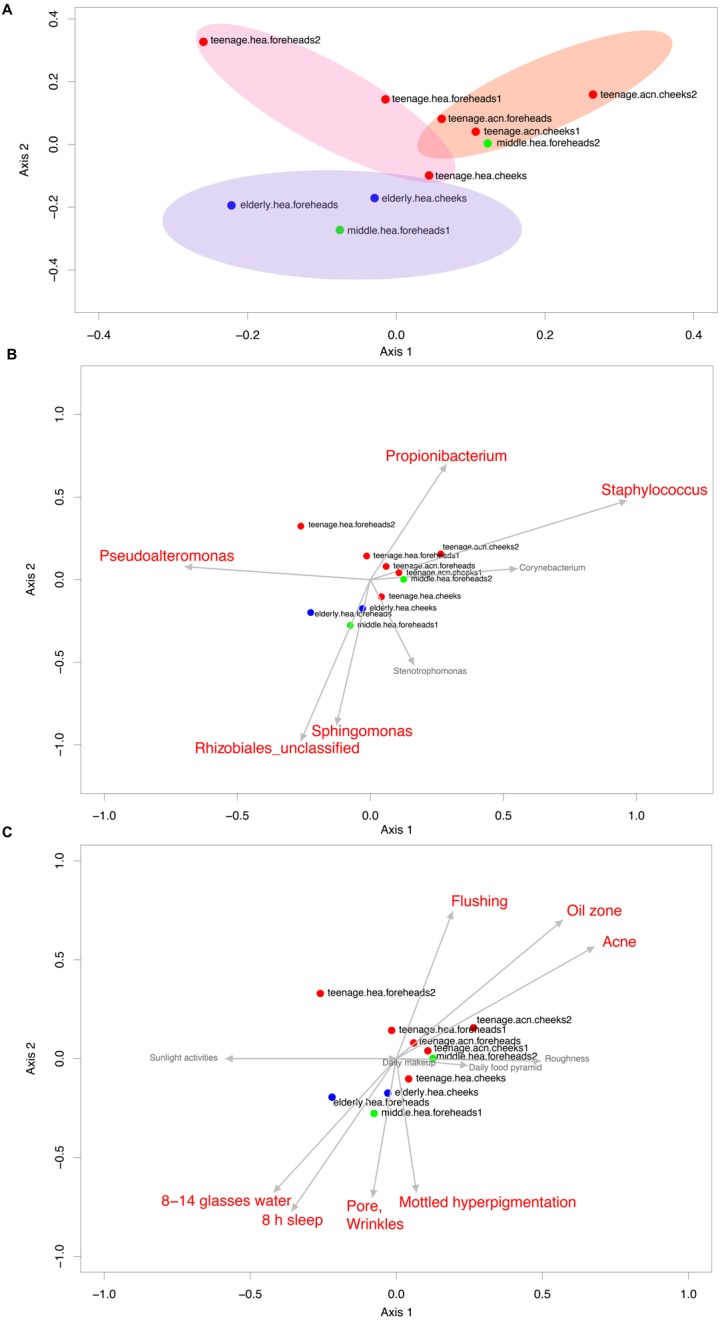
Figure 4. Non-metric multidimensional scaling based on Morisita-Horn dissimilarity indices, (A) without and (B, C) with Metastats analyses for representative (B) GLOTUs and (C) skin features.

The vector length indicates the strength of the association. The direction infers the direction of the effect. In (A), circle with different filled color denotes community closeness (i.e., blue for elderly.hea and middle.hea.foreheads1, and red for teenage.he a and teenage.acn.foreheads). Circle size is proportional to the number of subjects. In (B) and (C), arrow with red font indicates the feature with significant statistics (p < 0.05), and arrow with the smaller size and in gray font (i.e., Corynebacterium, and roughness) indicates the feature with non-significant statistics (p > 0.05).
