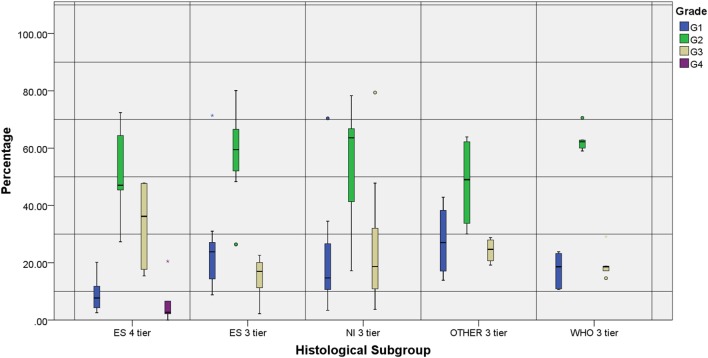
Figure 3.
Individual grade distribution according to the reference subgroup and number of tiers. All groups represented show a higher distribution of the intermediate grades compared to the marginal ones. Two studies that were not included in the chart—WHO 4-tier (G1: 8.9%, G2: 45.5%, G3: 42.7% and G4: 2.8%) and NI 4-tier (G1: 7%, G2: 59%, G3: 32% and G4: 2%)—reproduced the distribution observed in the ES 4-tier category.

