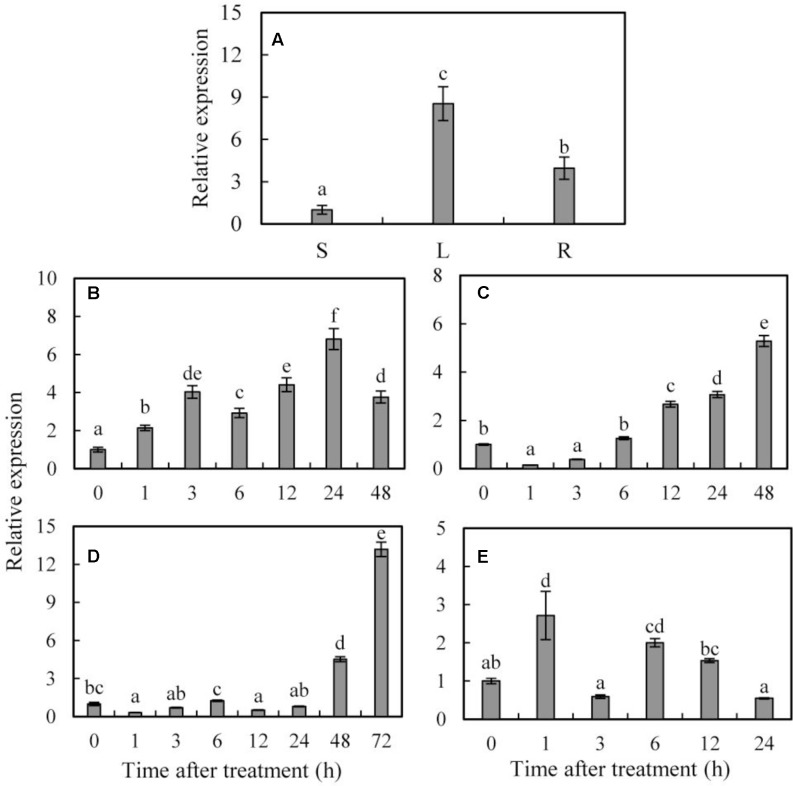
FIGURE 1.
Organ expression assay of SoCYP85A1 and expression profiles of SoCYP85A1 under treatments with PEG, ABA, 4°C and NaCl. (A) Organ expression assay of SoCYP85A1 in spinach. The organs (stem, leaf, and root) are represented by S, L, and R, respectively. (B) 20% PEG6000; (C) 100 μM ABA; (D) 4°C; (E) 200 mM NaCl. The expression level of stem for organ expression assay and for stress assay at time point 0 were defined as 1. Error bars represent standard deviations (SD) for three independent replicates with different letters at P < 0.05 significant level.

