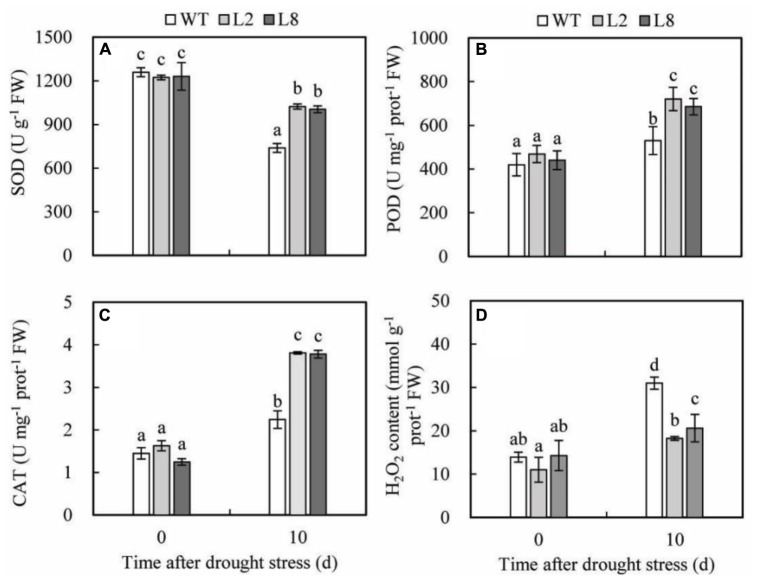
FIGURE 7.
Analysis of three antioxidant enzymes’ activities and H2O2 accumulation in WT and transgenic lines (L2 and L8) under drought stress. Six-week-old seedlings were withheld water for 10 days to assess SOD (A), POD (B), CAT (C), and H2O2 (D). Error bars represent SD and values with different letters are significant at P < 0.05.

