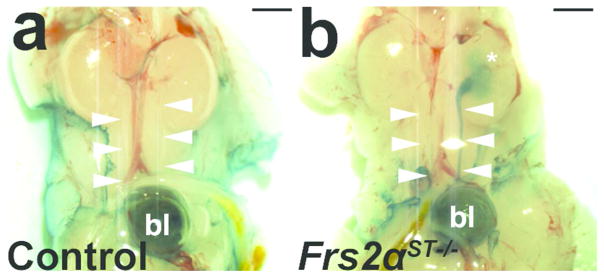
Figure 4. Cystograms in P1 Frs2αST−/− and control mice.
(a) Representative image of a control cystogram revealing methylene blue dye in the bladder (bl), no dye present in the ureters (arrowheads). (b) Image of a Frs2αST−/− cystogram illustrating dye present in the bladder that tracked up the left ureter into the left renal pelvis (*). Scale bar = 500μm.

