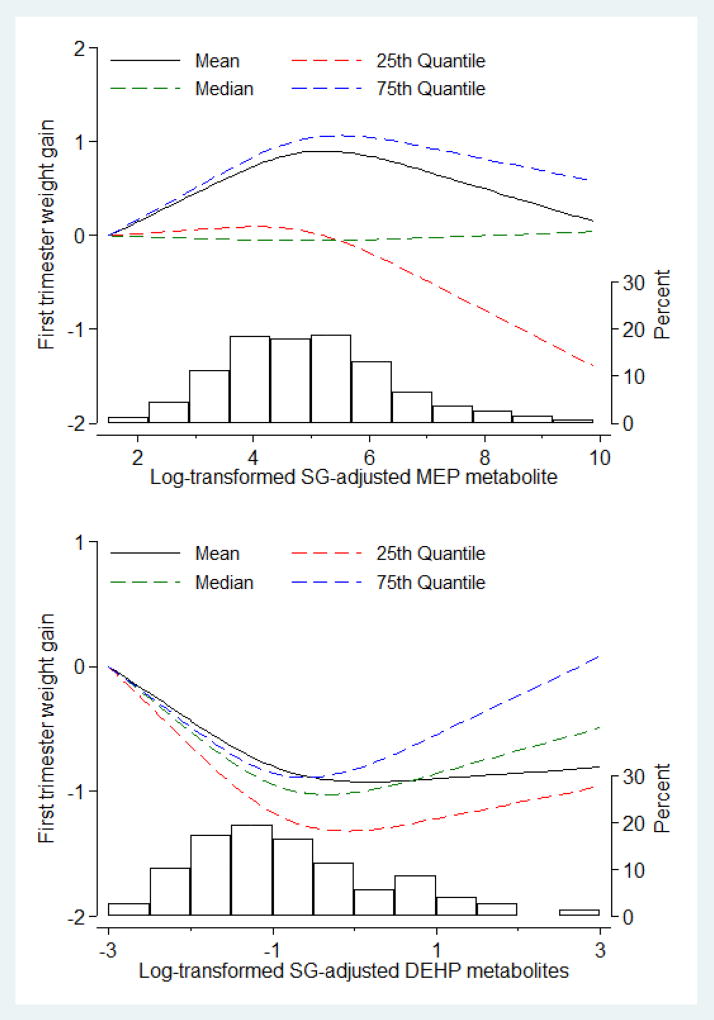
Figure 2. Multivariable-adjusted distribution shifts of early gestational weight gain (GWG, kg) as a function of 1st trimester urinary MEP and ΣDEHP phthalate metabolites levels. Shifts are at the mean, 25th, 50th, and 75th percentile of the outcome distribution.
MEP and ΣDEHP concentration were flexibly modeled with restricted cubic splines with the lowest concentrations serving as referent value. The histograms depict the distribution of the metabolite in the study population. Models are adjusted for maternal age, race/ethnicity, education, smoking, alcohol, baseline BMI

