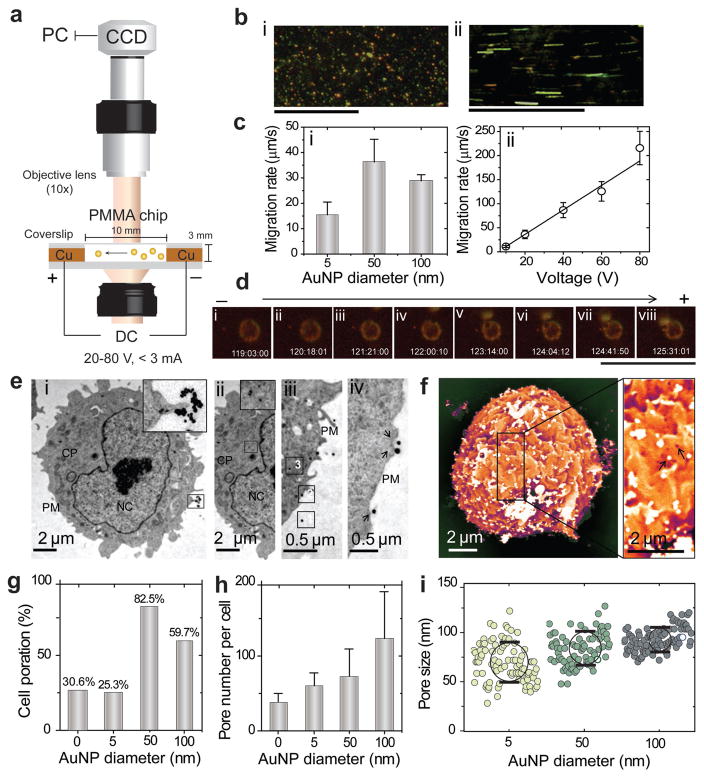
Figure 2.
Au nanoparticles oscillation and cell poration analysis. a) Schematic of DC electrophoretic mobility assay of Au nanoparticles (AuNPs) using DFM system supported with a specifically designed poly(methyl methacrylate) (PMMA) chip. b) Representative DFM images of Au nanoparticles: (i) 50 nm AuNPs; (ii) 50 nm AuNPs under an electric field of 60 V in 1x TAE. Scale bars are 100 μm. c) Oscillation rates of AuNPs: (i) AuNPs of different sizes (5, 50, 100 nm) under 20 V; (ii) 50 nm AuNPs under the effect of different voltages (20, 40, 60, 80 V). d) DFM imaging of the interaction of a single 100 nm AuNP with CHO-K1 cell under 20 V. The scale bar is 100 μm. e) TEM analysis of cell poration and particle entry into CHO-K1 cells: (i) 50 nm AuNPs on the surface of cell; (ii) 50 nm AuNPs in the cytoplasm of cells; (iii) steps (1–3) of AuNPs entry into the cells; (iv) the relation between the incidence of cell membrane poration and the presence of 100 nm AuNPs on the cell surface. Arrows are indicating clear ruptures in cell membrane frequently exist with the presence of AuNPs on the cell surface. CP, cytoplasm; PM, plasma membrane; NC, nucleus. f) SEM image of CHO-K1 cell poration with 100 nm AuNPs. The position of pores is related to the presence of AuNPs on the surface of cells, as indicated by arrows. g) Cell poration (%) as calculated from the number of porated cells to nonporated cells. h) Pore number per cells. i) The size distribution and uniformity of pores. All error bars represent standard deviations.

