Figure 4.
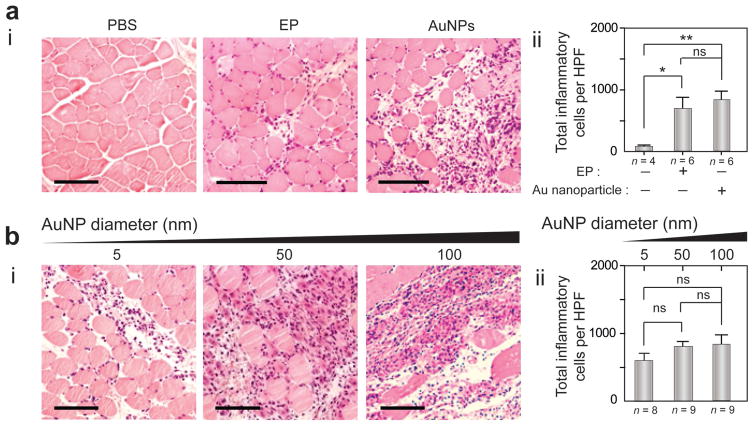
Hematoxylin and eosin (H&E) staining of TA muscle tissue after OPN Vac treatments in mice. a) H&E analysis of muscle tissue in mice 3 days after receiving treatment with electric pulsing (EP) or Au nanoparticles (AuNPs) alone, compared to phosphate buffered saline (PBS) control: (i) representative sections of treated tissue; (ii) quantification of total inflammatory cells per HPF. b) H&E analysis of muscle tissues in mice 3 days after OPN Vac treatments using AuNPs of different sizes (5, 50, and 100 nm): (i) representative sections of treated tissue; (ii) quantification of total inflammatory cells per HPF. The scale bar is 100 μm. The results are expressed as the average values of two independent experiments. All error bars represent standard deviations. *P < 0.05, **P < 0.01, ***P < 0.001; ns, nonsignificant versus the corresponding control mice (no Au nanoparticles), calculated using the Mann–Whitney test.

