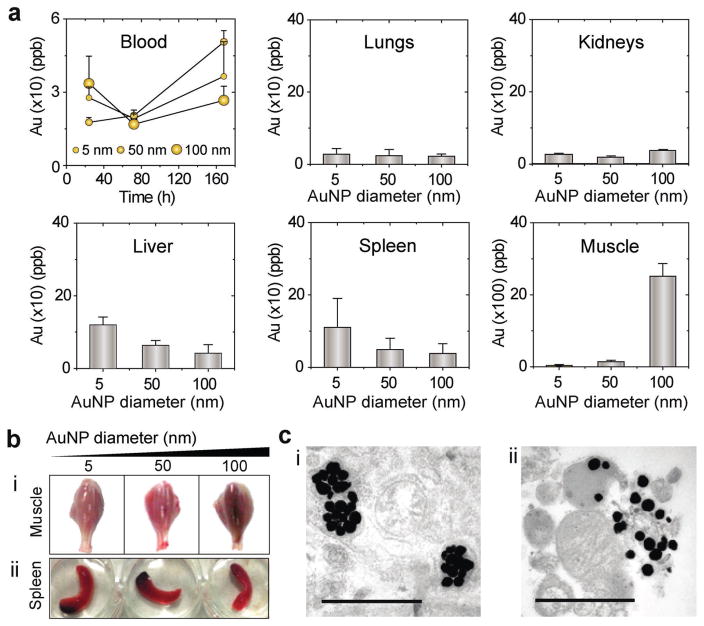
Figure 6.
Biodistribution analysis and organ uptake of Au nanoparticles after OPN Vac treatments in mice. a) Blood circulation and quantitative organ uptake of Au nanoparticles (AuNPs) 3 days post OPN treatment. The results are expressed as the average values of two independent experiments. All error bars represent standard deviations. b) Whole mounts of the lower part of the hind legs of mice 3 days after OPN Vac treatment (i), and spleen 1 day after OPN Vac treatment (ii). The images show normal organ morphology and the accumulation of AuNPs remained visible at the tested times. c) Signs of tissue interaction with AuNPs and its removal through phagocytosis observed by TEM in muscle tissues 3 days after OPN treatment. The scale bar is 1 μm.

