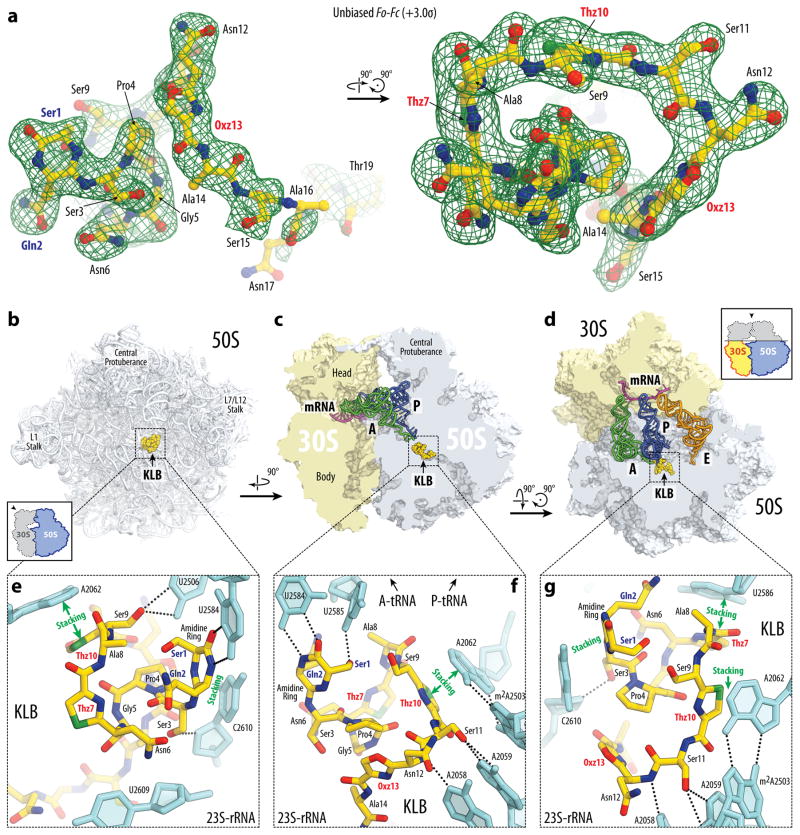
Figure 3. Structure of KLB-70S ribosome complex with A- and P-tRNAs.
(a) Difference Fourier electron density map of KLB in complex with the T. thermophilus 70S ribosome (green mesh). The refined model of the compound is displayed in its respective electron density before refinement viewed from two different perspectives. The unbiased (Fobs – Fcalc) difference electron density map is contoured at 3.0σ. Carbon atoms are coloured yellow, nitrogens are blue, oxygens are red, and sulfurs are green. Note that only the first 19 residues of KLB are visible in the electron density. (b, c, d) Overview of the KLB binding site (yellow) on the T. thermophilus 70S ribosome viewed from three different perspectives. 30S subunit is shown in light yellow, 50S subunit is in light blue. mRNA is shown in magenta and tRNAs are displayed in green for the A-site, in dark blue for the P-site, and in orange for the E-site. In (b), the 50S subunit is viewed from the inter-subunit interface (30S subunit, mRNA and tRNAs are removed for clarity), as indicated by the inset. The view in (c) is from the cytoplasm onto the A site. The view in (d) is from the top after removing the head of the 30S subunit and protuberances of the 50S subunit, as indicated by the inset. (e, f, g) Close-up views of the KLB binding site shown in panels (b), (c), and (d), respectively. E. coli numbering of the nucleotides in the 23S rRNA is used.

