Figure 8.
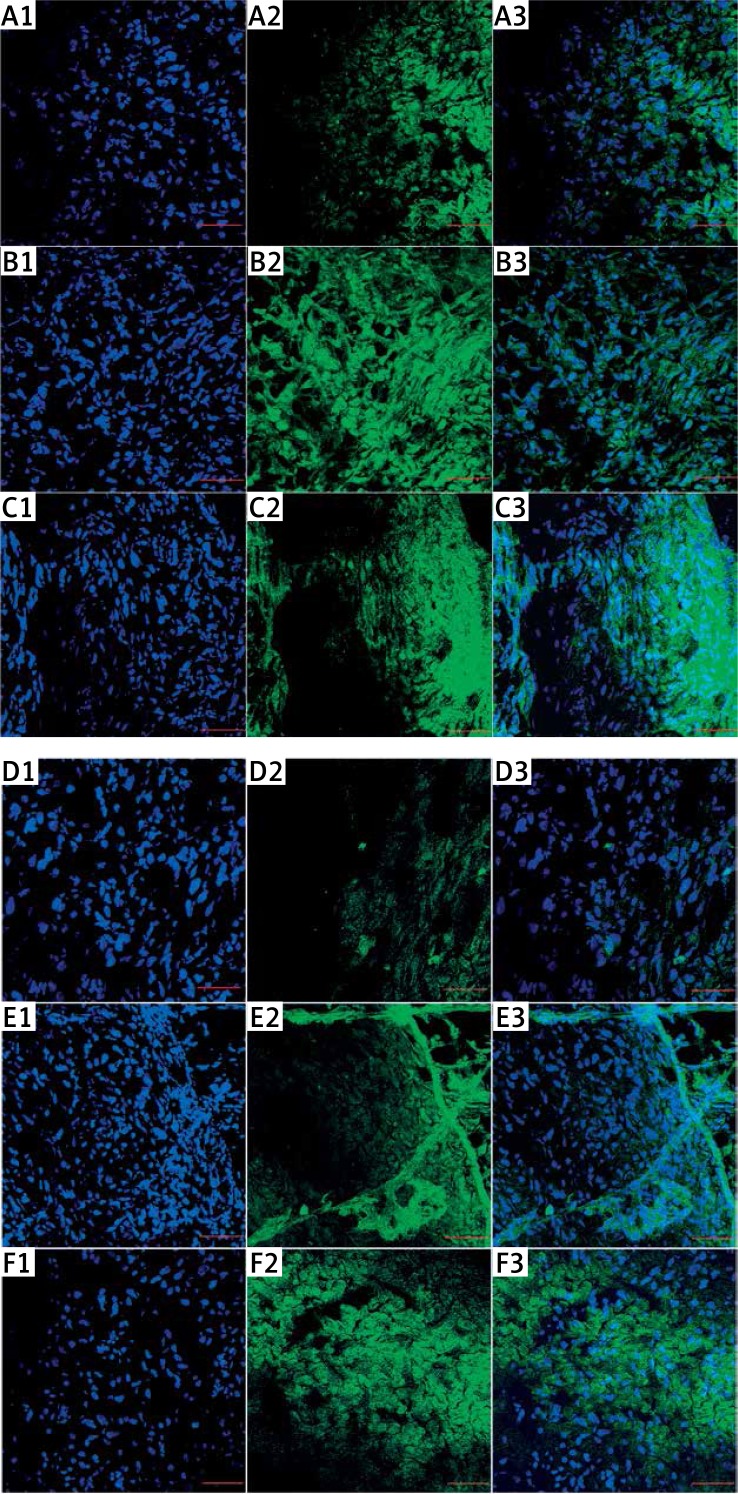
Protein expression level of p53 and caspase-3. Visualization of p53 (A, B, C) and caspase-3 (D, E, F) in glioblastoma tumors, shown as an overlaid image of 4′,6-diamidino-2-phenylindole-stained nuclei (blue (A1, B1, C1, D1, E1, F1)) and cytoplasm p53 stained with fluorescent secondary antibody 488 FITC (green) (A2, B2, C2), and caspase-3 stained with fluorescent secondary antibody 488 Alexa Fluor (green) (D2, E2, F2), in the cross-section of the tumors, visualized using a confocal microscope
A1-3, D1-3 – control group, B1-3, E1-3 – nanoparticles of platinum, C1-3, F1-3 – cisplatin. Scale bars: 100 μm.

