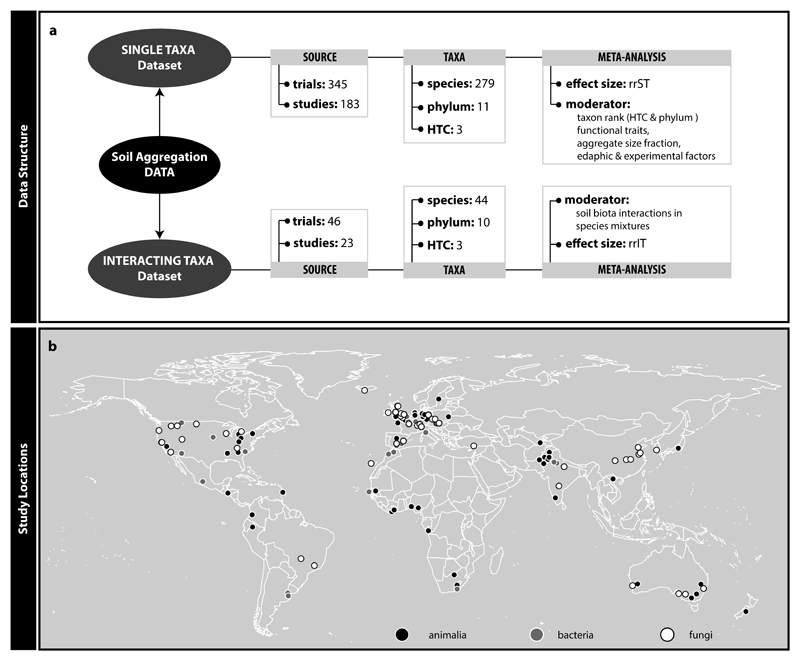
Figure 1.
Information on data structure (a) and study locations (b). We constructed two datasets (Single Taxa and Interacting Taxa dataset) from the data we collected following the literature search. These datasets differ in data volume, comprised taxonomic groups (higher taxonomic category, phylum, and species), effect size calculated and moderator variables tested. The map marks locations of studies included in this meta-analysis. There were a total of 129 different locations of which 59 investigated the impact of animals, 34 of bacteria and 55 of fungi on soil aggregation (note that in some sites more than one higher-level taxon was investigated). The map was drawn with the maps() function in R 50.

