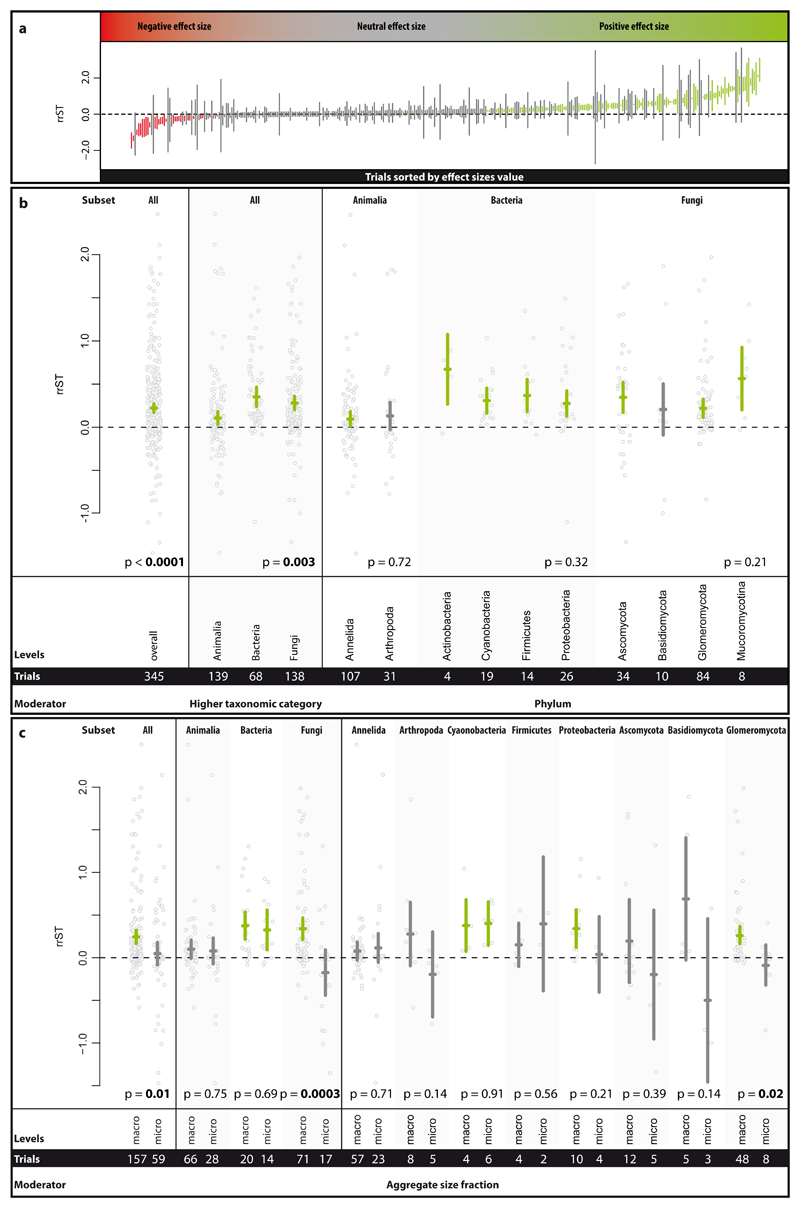
Figure 2.
Effect size range in the Single Taxa dataset (a) and effect of higher taxonomic category (HTC), phylum and aggregate size fraction on the effect size rrST (b and c). In panel a, the effect size values of each trial (not study) sorted by increasing effect size value are depicted, comprising 30 negative, 210 neutral and 105 positive effect size values. Effect sizes of which the 95% confidence intervals (CI) overlap the zero line (dashed line) have no clear positive or negative effect. In panel b, the summary effect over all studies included in the analysis of the Single Taxa dataset is presented. The influence of the phylum on the effect size was tested in respective subsets (soil animals, bacteria and fungi). In panel c, the impact of the aggregate size fractions (macro- vs. microaggregates) on the effect size was tested over all trials (of the Single Taxa dataset) and the respective HTC and phylum subsets. Effects are displayed as means and 95% CIs; below the p-values, the moderator levels and number of trials are shown. Significance test for between-level differences of moderators were based on a permutation test (random effects design); significant (p < 0.05) effects are marked in bold. Data points (grey) represent original data distribution of all corresponding trials.

