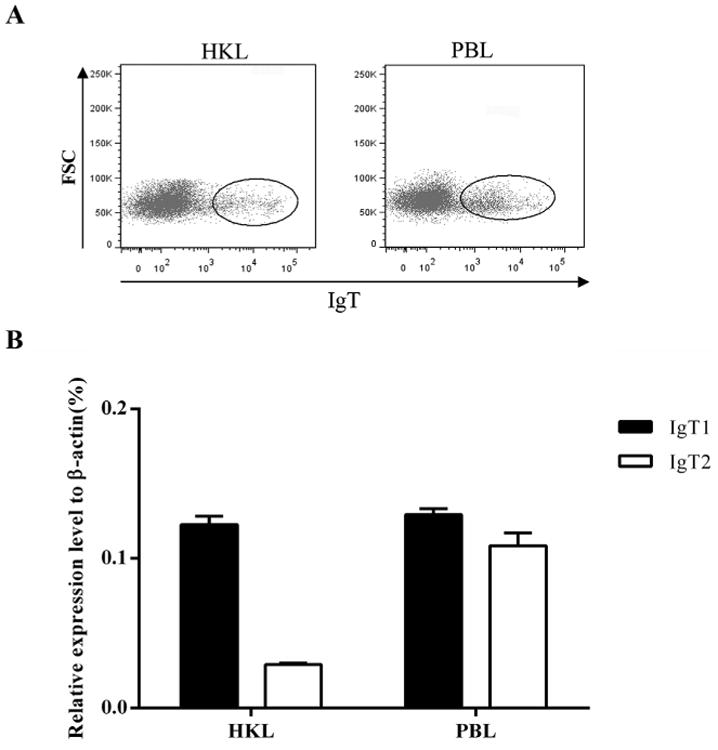
Fig. 7.

Expression analyses of trout Igτ genes in the sorted IgT+ B cells. (A) Anti-trout IgT1 mAb was used to sort the IgT+ B cells from HKLs and PBLs. (B) The relative expression levels of trout Igτ1 and Igτ2 were detected by qPCR, and β-actin was used as an internal control. The values represent the mean ± SD of three individual fish.
