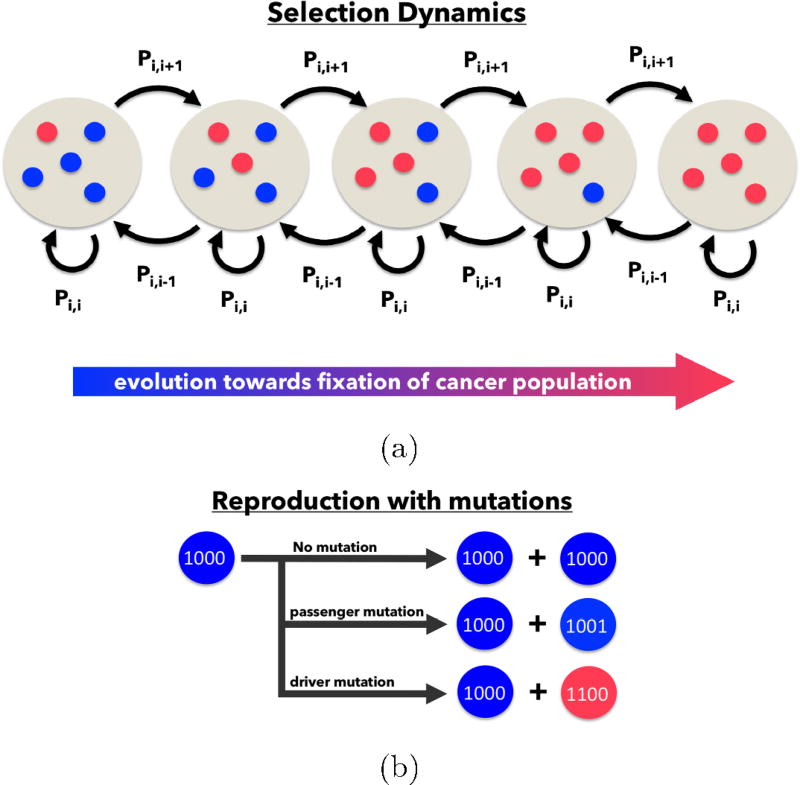
Figure 1.
Schematic of the Moran Process — (a) The number of cancer cells, i, is defined on the state space i = 0, 1, …, N where N is the total number of cells. The cancer population can change at most by one each time step, so a transition exists only between state i and i − 1, i, and i + 1. (b) During each time step, a single cell is chosen for reproduction, where an exact replica is produced. With probability m (0 ≤ m ≤ 1), a mutation may occur.

