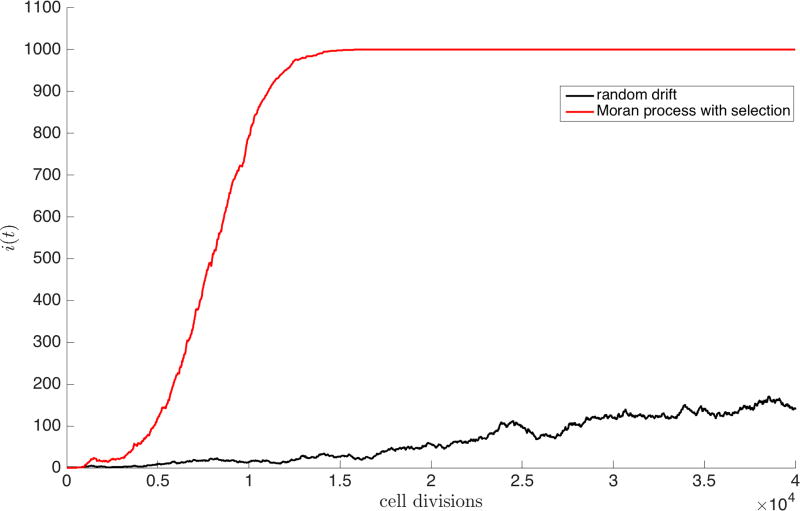
Figure 2.
Emergence of Gompertzian growth via selection — Random drift (black) plotted for a single simulation of 103 cells for 4 · 104 generations shows no particular shape. A single simulation of the Moran process (red) with selection (w = 0.5) and mutations (m = 0.1) gives rise to the characteristic S-shaped curve associated with Gompertzian growth.

