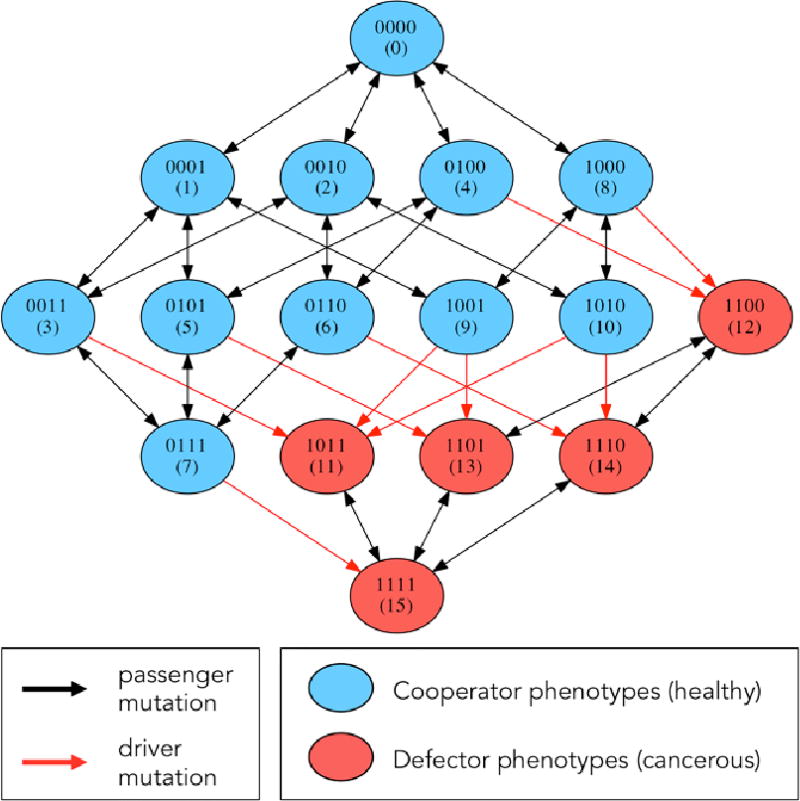
Figure 3.
Markov Point Mutation Diagram — Diagram shows 16 genetic cell types based on 4-digit binary string and the effect of a point mutation on each cell type. Blue indicates healthy cell type (0000 — 1010), red indicates cancerous cell type (1011 — 1111). Black arrows indicate passenger mutations (healthy to healthy or cancer to cancer), red arrows indicate driver mutations (healthy to cancer).

