Figure 4.
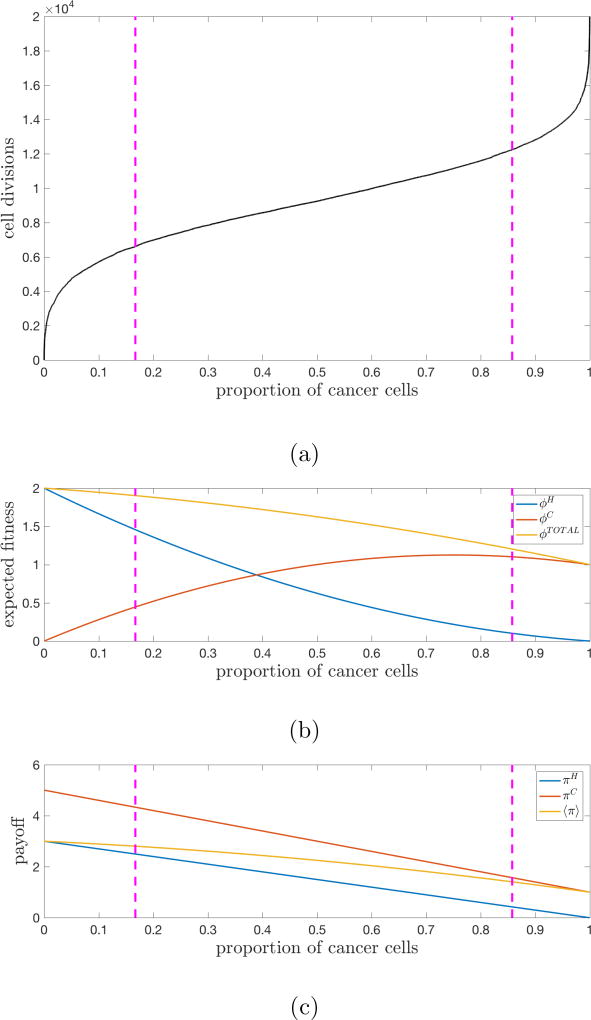
Tumor fitness drives tumor growth — (a) The average of 25 stochastic simulations (N = 1000 cells, w = 0.5, m = 0.1) is plotted for 20,000 cell divisions to show the cancer cell population (defectors) saturating. The pink lines delineate the regions of tumor growth (defined by the maximum and minimum points of the second-derivative of i(t)). (b) Fitness of the healthy population, cancer population, and total population plotted for the range cancer cell proportion. (c) Average payoff of a single healthy cell, cancer cell, and all cells plotted for the range cancer cell proportion.

