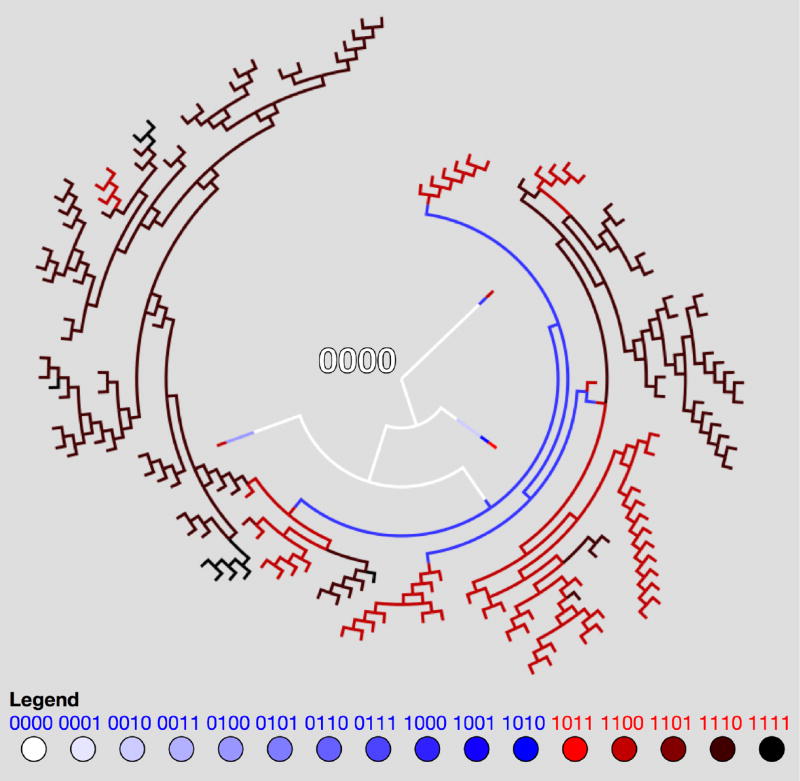
Figure 6.
Phylogenetic Tree — Sample dendritic phylogenetic tree tracking point mutations as time extends radially, depicting the emergence of molecular heterogeneity. The tree shows a simulation of 30 cells (all with genetic string 0000 at the beginning of the simulation) with strong selection (w = 1, m = 0.2). Pathways are color coded to indicate genetic cell type.

