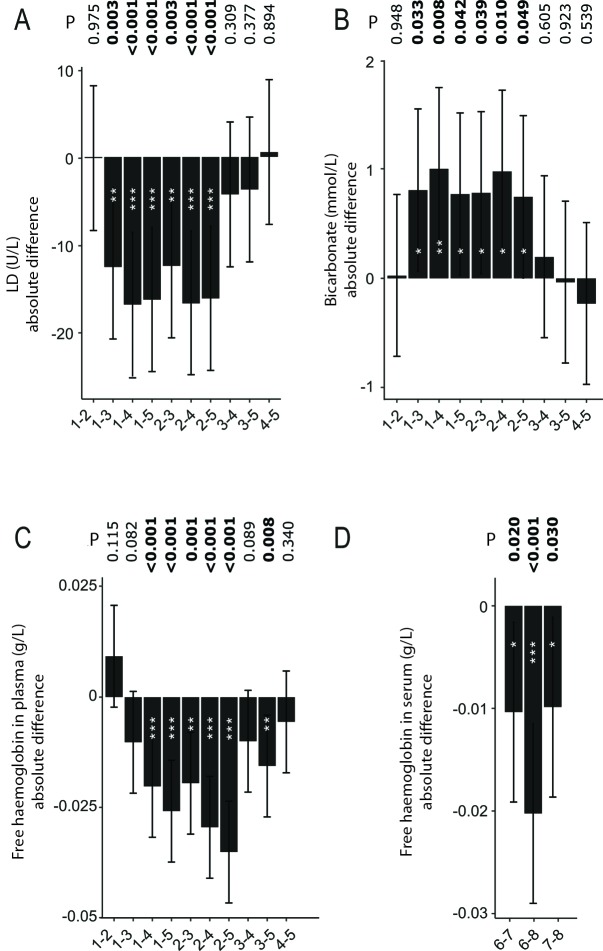
Figure 2.
Comparison of absolute results of lactate-dehydrogenase (A), bicarbonate (B), free haemoglobin in plasma (C) and serum (D) between centrifugation settings and tube types. Scales on the y-axis represent differences in absolute values of the respective analyte. IDs on the x-axis represent the different centrifugations settings: 1 – LiHepBar 2000xg/10min; 2 – LiHepBar 3000xg/5min; 3 – LiHepGel 2000/10min; 4 – LiHepGel 3000xg/5min; 5 – LiHepGel 3000xg/7min; 6 – Serum 2000xg/10min; 7 – Serum 3000xg/5min; 8 – Serum 3000xg/7min. *P < 0.05; **P < 0.01; ***P < 0.001. P-values < 0.05 were considered statistcally significant.

