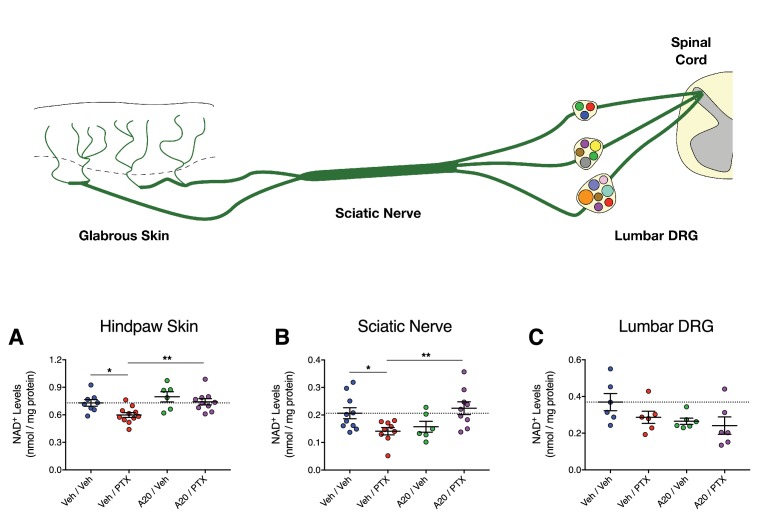
Figure 7. P7C3-A20 stimulates NAD recovery in peripheral neurons damaged by PTX in vivo.
(A–C) Tissue NAD+ levels in glabrous hindpaw skin (A), sciatic nerve (B), and lumbar DRG (C) collected from treated rats on day 10 of the experimental paradigm. As before, rats were treated daily with P7C3-A20 (20 mg/kg/day; i.p.) or vehicle beginning on day −2 through day 9, with PTX (11.7 mg/kg, i.p.) or vehicle injected on days 0, 2, and 4. On day 10, tissue samples were collected for homogenization and subsequent metabolite analysis using the NAD/NADH-Glo Assay (Promega, Madison, WI). Tissue NAD+ levels were normalized to total protein content. Bars identify the mean metabolite levels (nmol/mg protein)±SEM for each treatment group. Circles represent individual rat tissue NAD+ levels. **p<0.01, *p<0.05 vs. specified group by one-way ANOVA with Sidak’s post-hoc test, n = 6–11 tissue samples/group.

