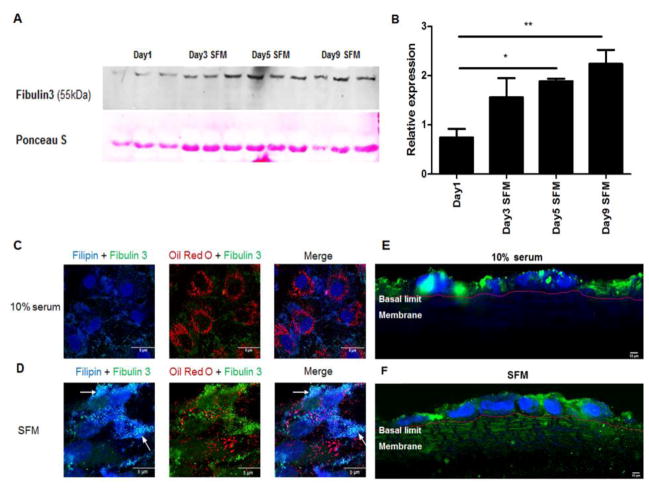
Figure 4. Serum starvation increased intracellular levels of Fib 3 in distinct granules and secreted levels in SFM over time.
A: Western blot showing expression of Fib3 in ARPE-19 cell culture media supernatant after the indicated number of days in serum-free medium. For the bands that showed progressive increases, the blots were scanned and quantitated using ImageJ. Ponceau S staining was used to normalize. B: Quantification of Fib3 in cell culture supernatant day 1–9. *, P < 0.05; **, P < 0.01. One-way ANOVA followed by Tukey’s multiple comparison test. N = 3. C: Filipin, Oil Red O and Fib3 staining of ARPE-19 in 10% serum. D: Filipin, Oil Red O and Fib3 staining of ARPE-19 in SFM. E–F: Immunofluorescence staining of Fib3 and DAPI in polarized ARPE-19 monolayer sections. ARPE-19 cells were grown on transwells, the membranes were embedded on 5% agarose gel and 100 μm sections were made using Leica_VT1000S_Vibratome. E: ARPE-19 in 10% serum. F: ARPE-19 in SFM. The basal limits of the cells and the beginning of the membrane is marked with a red line.

