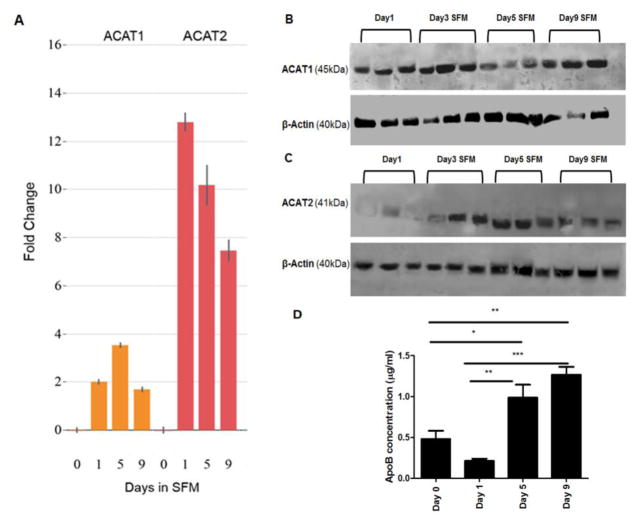
Figure 5. Serum deprivation increased ACAT2 expression and secreted ApoB concentrations in ARPE-19 cells.
A: Quantitative PCR analysis of ACAT1 and ACAT2 gene expression in ARPE-19 cells at day 0 (10% serum) and SFM at day 1, day 5 and day 9. Normalized fold change relative to day 0 values measured over the course of serum starvation. All measures normalized to the average values of ABCF3 and NOL8 genes. Error bars represent standard deviation. B–C: Western blots showing expression of ACAT1 (45kDa) and ACAT2 (41kDa) in ARPE-19 cell lysate after the indicated number of days in serum-free medium. Blots are representative of two to three replications each. D: Secreted ApoB concentrations in ARPE-19 cell culture media from day 0 (10% serum) days 1–9 in serum-free medium. Cell supernatants from each treatment were evaluated by specific ApoB ELISA kit *, P < 0.05; **, P < 0.01, ***, P < 0.001. One-way ANOVA followed by Tukey’s multiple comparison test. N = 4.

