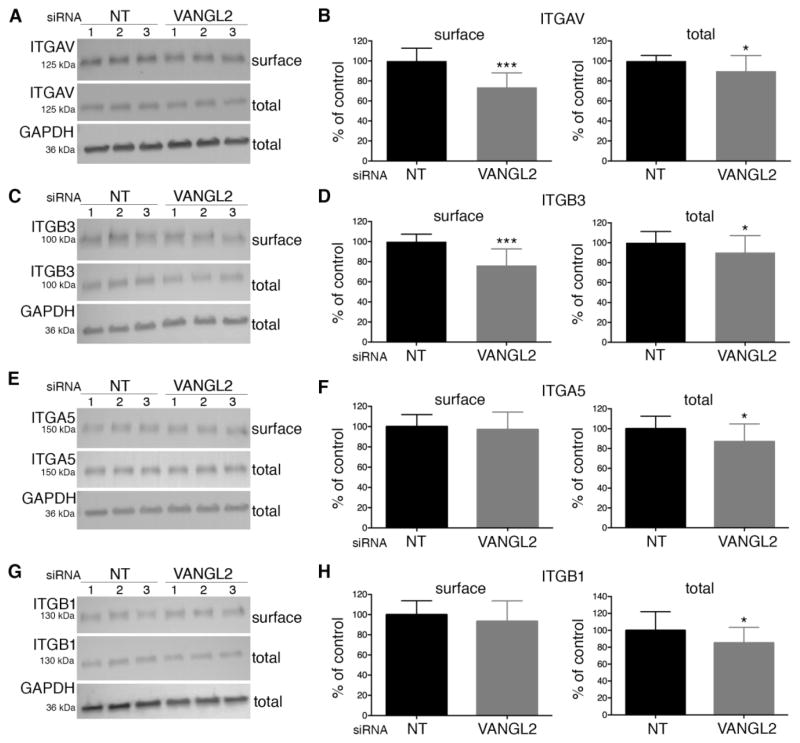
Fig. 2.
Integrin expression in VANGL2 knockdown HT-1080 cells. Western blot analyses and quantification of cell surface and total integrin protein expression in non-targeting control (NT) and VANGL2 siRNA transfected cells. (A,B) integrin αv (ITGAV). (C,D) integrin β3 (ITGB3). (E,F) integrin α5 (ITGA5). (G,H) integrin β1 (ITGB1). The numbers 1, 2, and 3 on each blot represent results from an experiment performed in triplicate. Significant differences are marked as follows: *p < 0.05; ***p < 0.0001.

