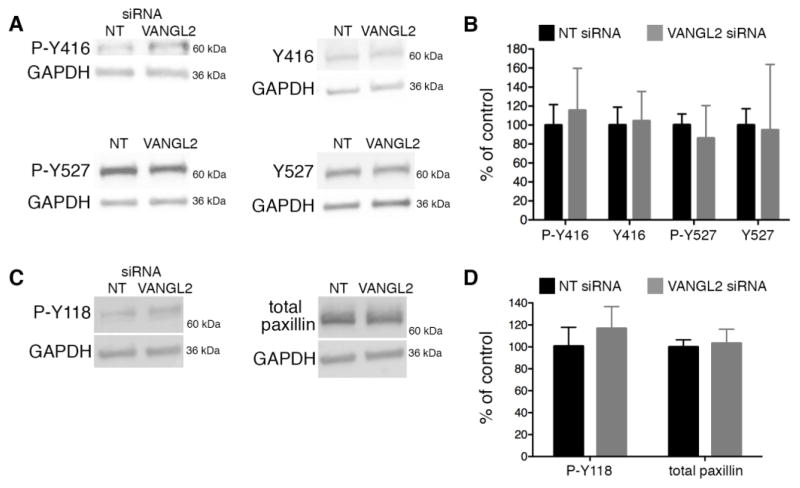
Fig. 3.
Src and paxillin activation in VANGL2 knockdown HT-1080 cells. Western blot analysis of Src and paxillin activation status in non-targeting control (NT) and VANGL2 (V2) siRNA transfected cells. Experiments were repeated five times and representative blots are shown. (A) P-Y416 (activated Src), Y416 negative control (non-phosphorylated), P-Y527 (inhibited Src), Y527 negative control (non-phosphorylated). (B) Quantification of panel (A) data. (C) P-Y118 (activated paxillin), total paxillin control. (D) Quantification of panel (C) data.

