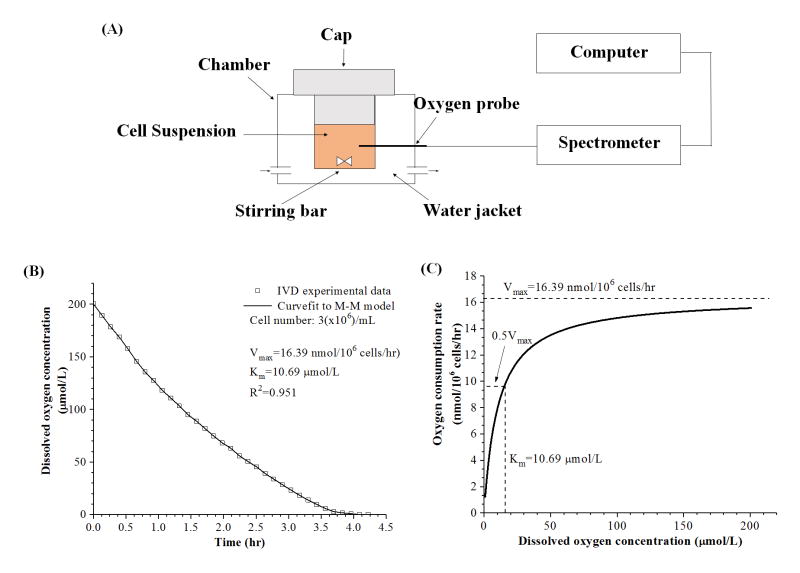
Figure 2.
(A) Schematic of the experimental setup for oxygen consumption rate experiments. AF, NP, and CEP cells were sealed in a water-jacketed metabolism chamber. (B) Characteristic curve of dissolved oxygen concentration (μmol/L) in the metabolism chamber over time (hr). (C) The oxygen consumption rate (nmol/106 cells/hr) was plotted against dissolved oxygen concentration (μmol/L) based on the Michaelis-Menten (M-M) equation with calculated coefficients of Vmax and Km.

