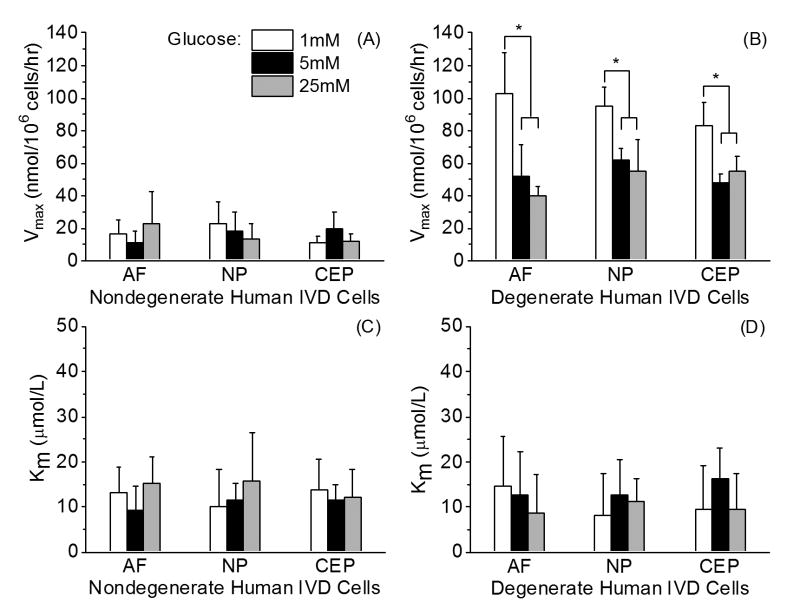
Figure 3.
Comparison of (A) Vmax and (C) Km among human nondegenerate AF, NP, and CEP cells cultured in DMEM with varying glucose concentrations (n = 5 separate oxygen consumption rate experimental runs for each cell type from three separate cell isolations). Comparison of (B) Vmax and (D) Km among human degenerate AF, NP, and CEP cells cultured in DMEM with varying glucose concentrations (n= 5 separate oxygen consumption rate experimental runs for each cell type from three separate cell isolations). Significant effects due to the glucose level were found for Vmax in all three regions (p<0.0001). Tukey's post hoc: * p<0.05.

