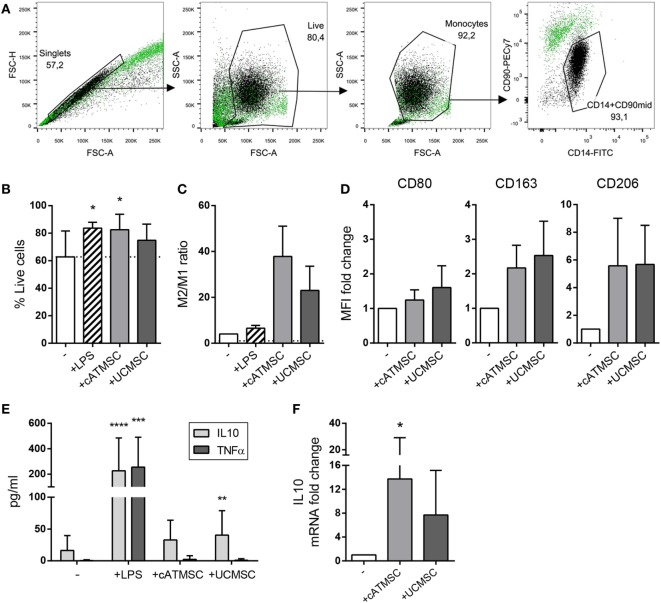
Figure 1.
cATMSCs and UCMSCs skew monocytes toward an “M2” phenotype. (A) Monocytes (CD14+/CD90mid) were separated by FACS after co-culture with cATMSCs or UCMSCs (CD14dim/CD90high). A representative gating analysis of monocytes co-cultured with UCMSCs (black dots) compared to UCMSCs alone (green dots) is shown. (B) Viability of co-cultured monocytes. Data are mean + SD of 11 independent experiments. (C) FACS-sorted monocytes were checked for the expression of M1 and M2 markers by qPCR after 48 h of co-culture. Data are expressed as mean + SD of the ratio between the M2 (ΣmRNA fold change of CD163, CD206, TGM2, and CCL18) and M1 marker (mRNA fold change of CD80) depicted in Figure S1 in Supplementary Material. Data accounts for three independent experiments. (D) Fold increase in CD80, CD163, and CD206 MFI of monocytes cultured for 72 h with cATDPCs or UCMSCs, relative to monocytes alone (−). Data accounts for three independent experiments. (E) IL10 and TNFα cytokine levels in 72 h-culture supernatants. Data are mean + SD of 12 independent experiments. Statistical differences are indicated where *p < 0.05 by one-way ANOVA with Tukey’s post hoc test compared to monocytes cultured alone (−). (F) Fold increase in IL10 mRNA of monocytes cultured for 48 h with cATDPCs or UCMSCs, relative to monocytes alone (−). Data accounts for four independent experiments. cATMSCs, cardiac adipose tissue-derived MSCs; UCMSCs, umbilical cord MSCs; TNFα, tumor necrosis factor α.

