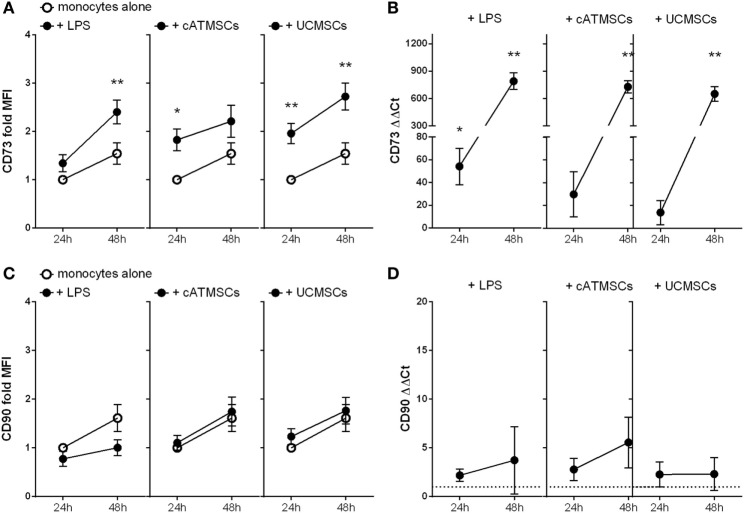
Figure 3.
CD73 is induced while CD90 remains unchanged in monocytes co-cultured with cATMSCs and UCMSCs. (A,C) Fold increase in CD73 and CD90 MFI of monocytes cultured for 24 or 48 h with LPS, ATDPCs, or UCMSCs (black dots), relative to 24 h-cultured monocytes alone (white dots). Statistical differences are indicated where *p < 0.05 and **p < 0.01 by two-way ANOVA compared to monocytes cultured alone. (B,D) Fold increase in CD73 and CD90 mRNA (ΔΔCt) of monocytes, relative to monocytes cultured alone. Statistical differences are indicated where *p < 0.05; **p < 0.01; and ***p < 0.001 by one-sample T test. Data are expressed as mean ± SD and accounts for four independent experiments of different monocyte and MSC donors. MSC, mesenchymal stem cell; cATMSCs, cardiac adipose tissue-derived MSCs; UCMSCs, umbilical cord MSCs.

