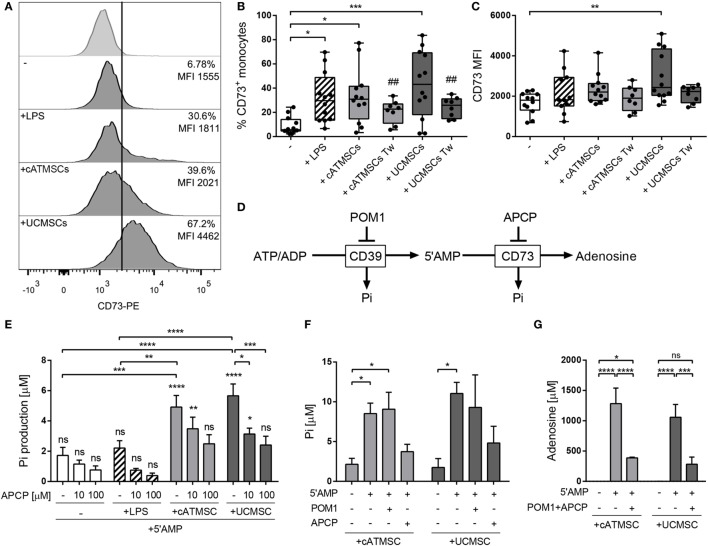
Figure 4.
Monocytes co-cultured with cATMSCs or UCMSCs upregulate the adenosinergic enzymatic activity. Monocytes cultured for 72 h alone (−) or with LPS, cATMSCs or UCMSCs were checked for CD73 surface expression and activity. (A) Representative histograms of CD73 expression. The isotype control is depicted in the top row; the % of positive cells and the MFI for the total monocyte population (CD14+/CD90mid) are indicated in each plot. (B) Percentage of CD73+ and (C) CD73 MFI of monocytes as mean ± SD of 12 independent experiments. Tw: co-culture in transwell system. Statistical differences are indicated where *p < 0.05, **p < 0.01, and ***p < 0.001 by one-way ANOVA with Tukey’s post hoc analysis. (D) Schematic representation of the enzymatic hydrolysis of ATP/ADP to 5′AMP by CD39 and to Ado by CD73, which can be inhibited by POM1 and APCP, respectively. Inorganic phosphate (Pi) is produced as a byproduct in each step. (E) Levels of inorganic phosphate (Pi) produced by FACS-sorted monocytes analyzed after the addition of the CD73 substrate (5′AMP; 1 mM) with or without the CD73 inhibitor (APCP). Data are presented in bars as the mean + SD concentration of Pi subtracted from the Pi present in monocytes without 5′AMP. Data account for 9–13 independent experiments. (F,G) Levels of inorganic phosphate (Pi) (F) and of Ado (G) produced by FACS-sorted monocytes analyzed after the addition of the CD73 substrate (5′AMP; 1 mM) with or without the CD39 inhibitor (POM1) or the CD73 inhibitor (APCP). Data are presented in bars as the mean + SD concentration of Pi. Data accounts for four independent experiments. Statistical differences in each bar are compared to cells without 5′AMP or to the indicated groups where *p < 0.05, **p < 0.01, ***p < 0.001, and ****p < 0.0001 by two-way ANOVA with Tukey’s post hoc analysis. cATMSCs, cardiac adipose tissue-derived MSCs; UCMSCs, umbilical cord MSCs; ATP, adenosine triphosphate; Ado, adenosine.

