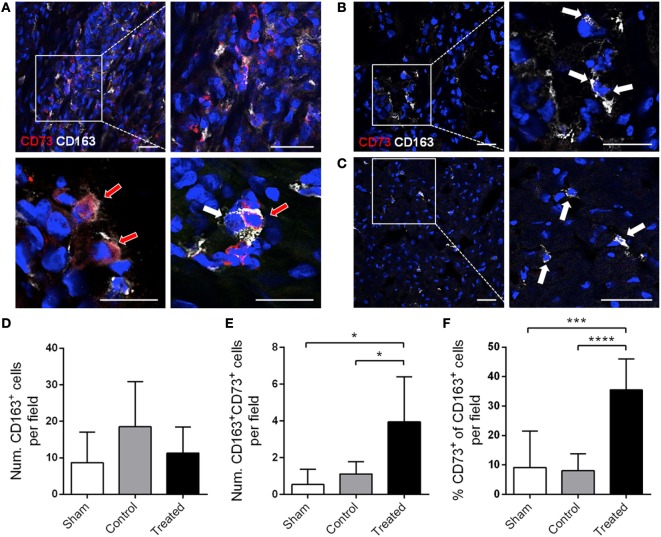
Figure 7.
CD73 is also induced in vivo in host monocytes in swine post-infarcted myocardium treated with porcine cATMSCs. (A–C) Infiltrating CD163+ monocytes (white arrows), some of them expressing CD73 (red arrows) in a cATMSC-treated animal (A), and CD163+ monocytes (white arrows) in a control (B) and sham (C) animals, both negative for CD73. CD73 is shown in red and CD163 in white, and nuclei are counterstained with DAPI in blue. Scale bars = 50 µm. (D,E) Histograms showing the number of CD163+ monocytes (D), CD73+ CD163+ monocytes (E) per optical field in all studied groups. (F) Percentage of CD73+ monocytes out of the CD163+ monocytes. Differences in immunohistochemical quantifications were compared using one-way ANOVA for multiple comparisons, with Tukey’s test for the post hoc analysis. cATMSCs, cardiac adipose tissue-derived MSCs; DAPI, 4′,6-diamidino-2-phenylindole dihydrochloride.

