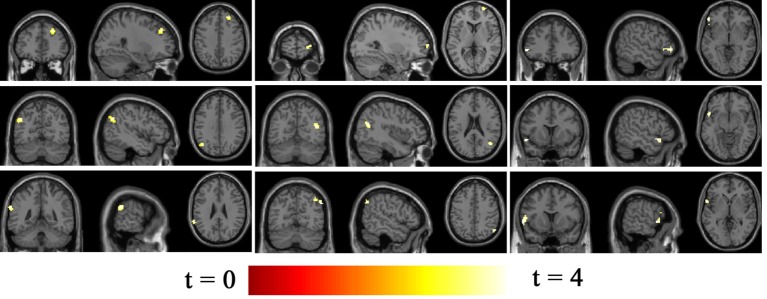
Figure 3.
Differences in network connectivity in participants between betel quid (BQ) dependence and healthy control, determined through two sample t-tests (p < 0.001 uncorrected). Increased connectivity networks in participants with BQ dependence from left to right (top row: orbitofrontal, right frontoparietal, frontotemporal. Second row: left frontoparietal, occipital/parietal, frontotemporal/cerebellum. bottom row, first one: temporal/limbic) and decreased networks from left to right (bottom row, second and third: parietal and medial frontal/anterior cingulated). The color bars represent the range of t value.

