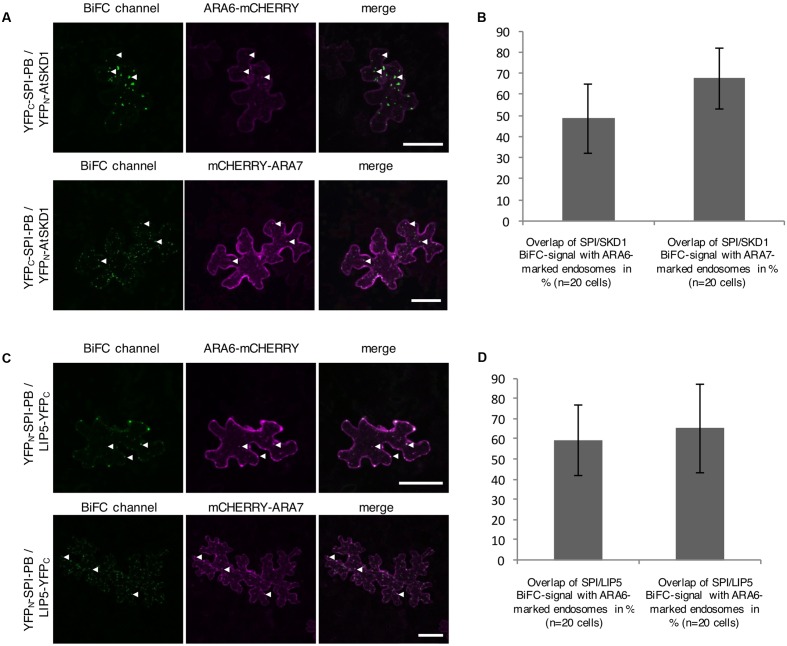
FIGURE 3.
Bimolecular fluorescence complementation (BiFC) interactions of SPI-PBW on endosomes in infiltrated N. benthamiana leaf epidermis cells (related to Supplementary Figure S2). (A) BiFC interactions of YFPC-SPI-PBW and YFPN-SKD1 in cells co-expressing ARA6-mCHERRY (Upper) or mCHERRY-ARA7 (Lower). Column III shows the merged pictures of columns I and II. Scale bars represent 50 μm. (B) Overlap (in %) between SPI/SKD1 BiFC signals and ARA6- or ARA7-labeled endosomes. Data denote the average of 10 cells. Error bars represent SDs. (C) BiFC interaction of YFPN-SPI-PBW and LIP5-YFPC in cells co-expressing ARA6-mCHERRY (Upper) or mCHERRY-ARA7 (Lower). Column III shows the merged pictures of columns I and II. Scale bars represent 50 μm. (D) Overlap (in %) of SPI-PBW/LIP5 BiFC signals overlapping ARA6- and ARA7-labeled endosomes. Data denote the average of 15 and 12 cells, respectively. Error bars represent SDs.

