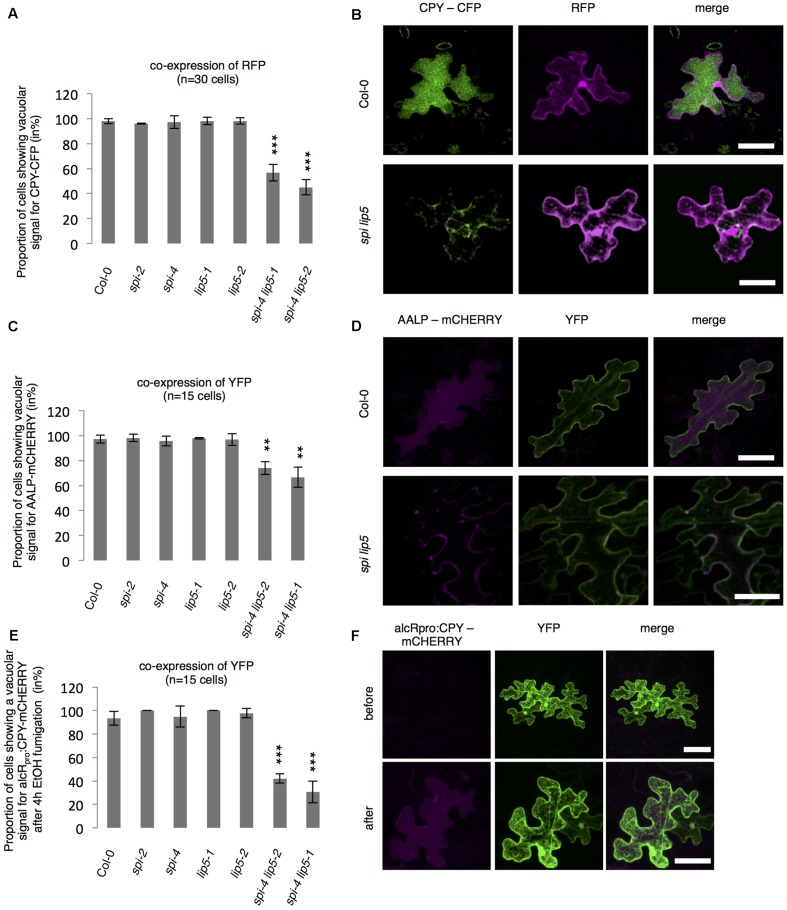
FIGURE 5.
Analysis of vacuolar transport in spi and lip5 mutants. (A) Number of cells (in %) showing a vacuolar signal for CPY-CFP in cells co-expressing free RFP. Data denote the average of three biological replicates (n = 30 cells each). (B) Representative maximum projections of CPY-CFP (column I) in transfected leaf epidermis cells of Col-0 (Upper) and spi lip5 double mutants (Lower) co-expressing free RFP (column II) as transformation control. Column III presents the overlay picture of columns I and II. (C) Number of cells (in %) showing a vacuolar signal for AALP-mCHERRY in cells co-expressing free YFP. Data denote the average of three biological replicates (n = 15 cells each). (D) Representative maximum projections of AALP-mCHERRY (column I) in transfected leaf epidermis cells of Col-0 (Upper) and spi lip5 double mutants (Lower) co-expressing free YFP (column II) as transformation control. Column III presents the overlay picture of columns I and II. (E) Number of cells (in %) showing vacuolar signal for alcRpro:CPY-mCHERRY in cells co-expressing free YFP 4 h after fumigation with 2% EtOH (related to Supplementary Figure S4). Data denote the average of three biological replicates (n = 15 cells each). Error bars in A,C,E represent SDs. Asterisks represent statistically significant changes in comparison to Col-0 (two-tailed Student’s t-test; ∗∗p < 0.01, ∗∗∗p < 0.001). (F) Representative maximum projections of alcRpro:CPY-mCHERRY (column I) before (Upper) and after induction of gene expression (Lower) in transfected leaf epidermis cells of Col-0 co-expressing free YFP (column II) as transformation control. Column III presents the overlay picture of columns I and II. Scale bars: 30 μm.

