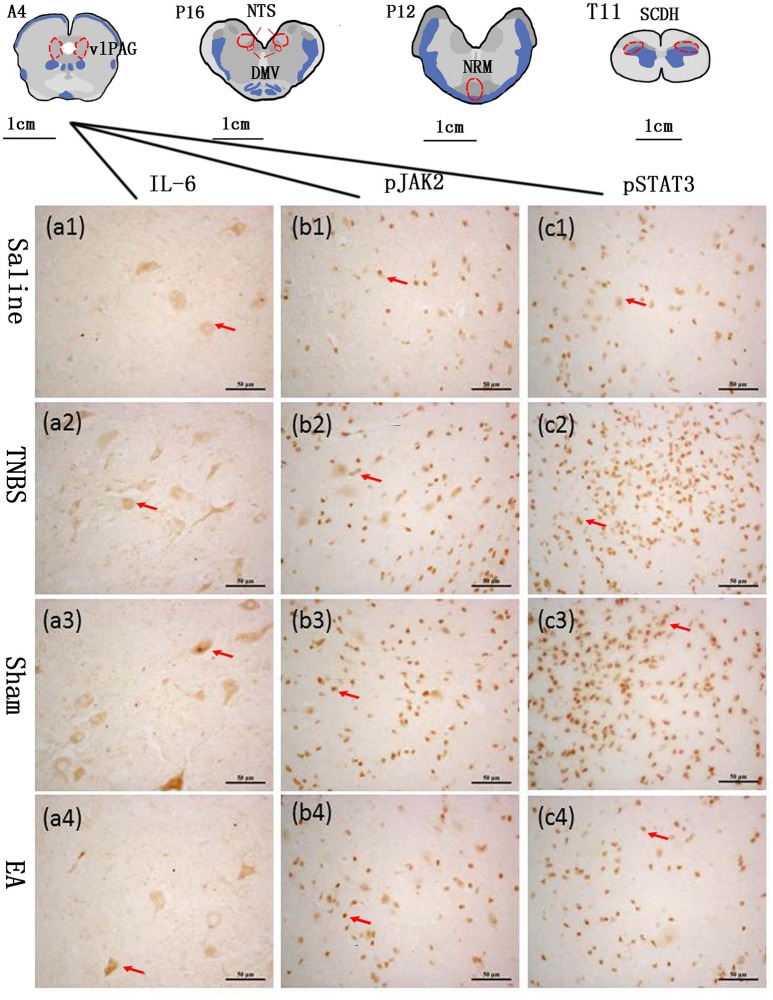
Figure 3.
The nuclei (areas) locations used for the IL-6-like, pJAK2-like and pSTAT3-like immunoreactive (IL-6-IR, pJAK2-IR and pSTAT3-IR) cells counts and the representative cells in the vlPAG. A6: the ventrolateral periaqueductal gray (vlPAG) at interaural levels of 6 mm. P12: the nucleus raphe magnus (NRM) at interaural levels of −12 mm. P16: the nucleus tractus solitarius (NTS) and the dorsal motor nucleus of vagi (DMV) at interaural levels of −16 mm. T11: the anterior part of the eleventh thoracic vertebra spinal cord dorsal horn (SCDH). (a1–a4) show positive IL-6-IR cells in the vlPAG in Saline, TNBS, Sham and EA group, respectively. (b1–b4) show positive pJAK2-IR cells in the vlPAG in Saline, TNBS, Sham and EA group, respectively. (c1–c4) show positive pSTAT3-IR cells in the vlPAG in Saline, TNBS, Sham and EA group, respectively. Arrows point to the positive cells. The cytoplasm or nuclei of positive cells was stained as brown yellow. The bars = 50 μm.

