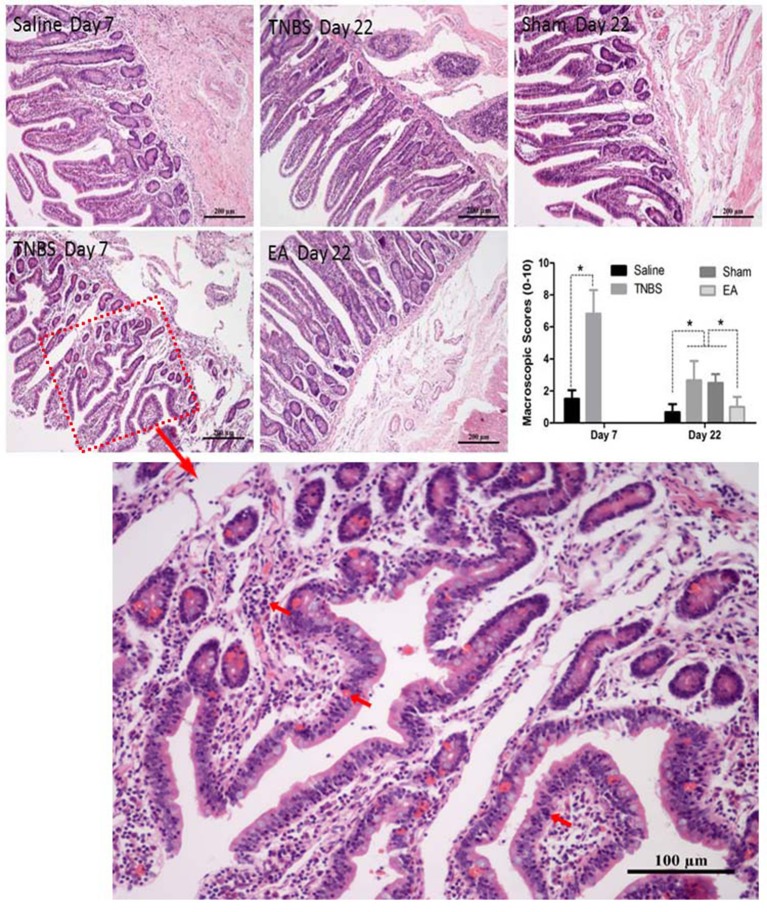
Figure 5.
Effect of ileitis and EA treatments on microscopic pathologic changes. Microscopic changes of the ileum stained with hematoxylin and eosin (HE) at day 7 and 22. Arrows point to the inflammation cells or blood vessel congestion. The bars = 200 μm or 100 μm. The microscopic change scores on a scale of 0–10 at day 7 (mean ± SD, n = 3) and 22 (mean ± SD, n = 6), crypt depth (0–2), inflammatory cells (0–3), blood vessel congestion (0–3), ulceration (0–2). *P < 0.05 Kruskal-Wallis analysis followed by Mann-Whitney U-test.

