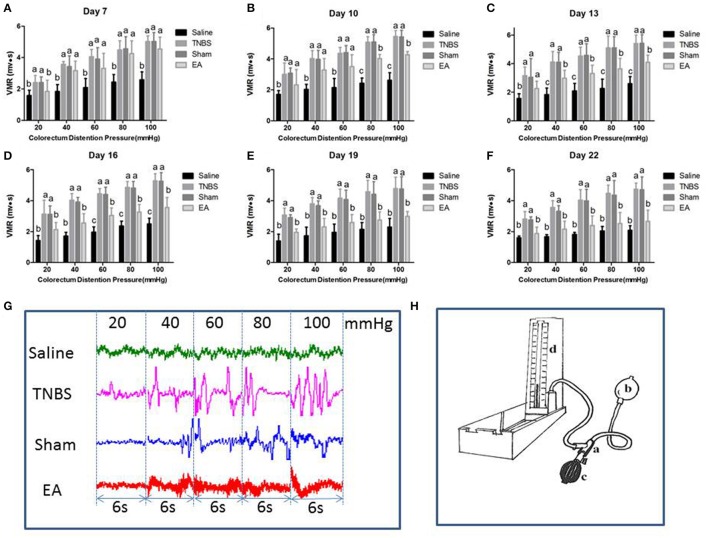
Figure 6.
(A–F) Effects of repeated EA treatments on visceromotor responses (VMR) to colorectal distention pressure measured with electromyography (EMG) at day 7, 10, 13, 16, 19, and 22 (mean ± SD, n = 6). The values with different letters differ significantly (P < 0.05). One-way ANOVA followed by Bonferroni's post-test. (G) The representative EMG traces with 20, 40, 60, 80, and 100 mmHg distention pressures at day 16. The pressure continuously increased from 20 to 40, 60, 80, and 100 mmHg by stage and lasted for 6 seconds at each stage. (H) The distension device made with a T-connector (a), connecting a balloon (b), a vacuum pump (c) and a sphygmomanometer (d).

