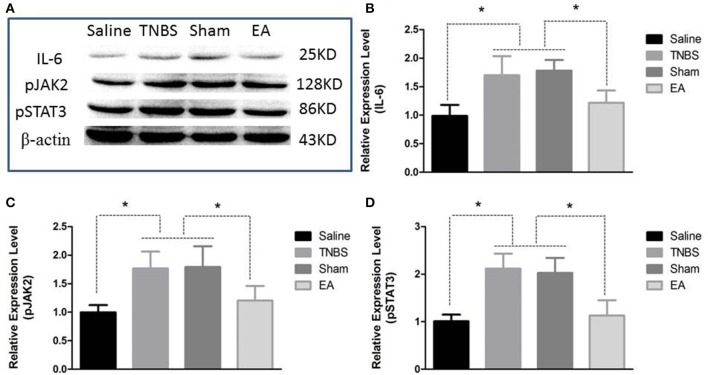
Figure 9.
Effects of EA treatments on the protein expression of IL-6, pJAK2, and pSTAT3 in the eleventh thoracic vertebra spinal cord dorsal horn (mean ± SD, n = 6). (A) The western blotting bands. (B) IL-6 expression. (C) phosphorylated JAK2 (pJAK2) expression. (D) phosphorylated STAT3 (pSTAT3) expression. *P < 0.05. One-way ANOVA followed by Bonferroni's post-test.

