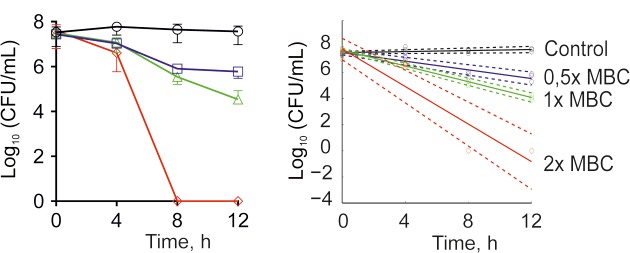
FIGURE 2.
Time-kill curves of F105 against MSSA cells. The numbers of CFU/mL were calculated by using drop plate approach (A) and respective dose-response curves were plotted providing residual CFU/mL as a function of exposition time (B). F105 is presented in different concentrations: untreated cells (black); 0.5× MBC (20 mg/L, blue); 1× MBC (40 mg/L, green); 2× MBC (80 mg/L, red). Full lines denote regression lines, while dashed lines denote corresponding 95% confidence intervals.

