
Figure 2.
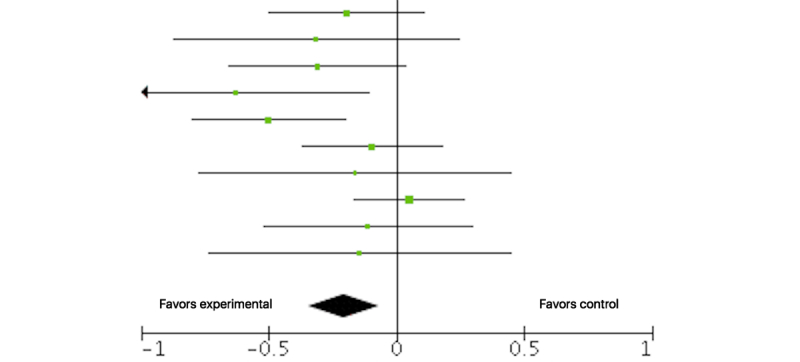
Forest plot of the standardized mean difference (95% CI) in pain intensity posttreatment between tailored Web-based interventions and standard care. Black diamond indicates overall treatment effect (tips=95% CI).
Official websites use .gov
A
.gov website belongs to an official
government organization in the United States.
Secure .gov websites use HTTPS
A lock (
) or https:// means you've safely
connected to the .gov website. Share sensitive
information only on official, secure websites.
Forest plot of the standardized mean difference (95% CI) in pain intensity posttreatment between tailored Web-based interventions and standard care. Black diamond indicates overall treatment effect (tips=95% CI).