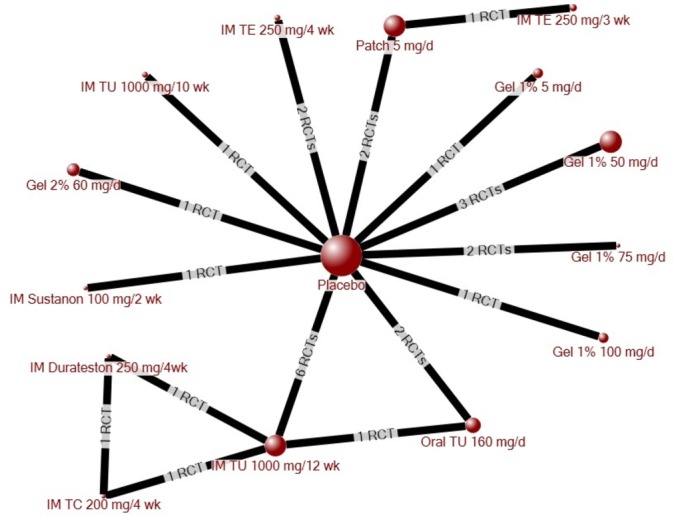
Figure 3.

Evidence network for quality of life. The size of each circle (node) is proportional to the number of randomly assigned patients and indicates sample size. The number of randomised-controlled trials (RCTs) that contributed to each direct comparison is indicated on the line between nodes. IM, intramuscular injection; TC, testosterone cypionate; TE, testosterone enanthate; TU, testosterone undecanoate.
