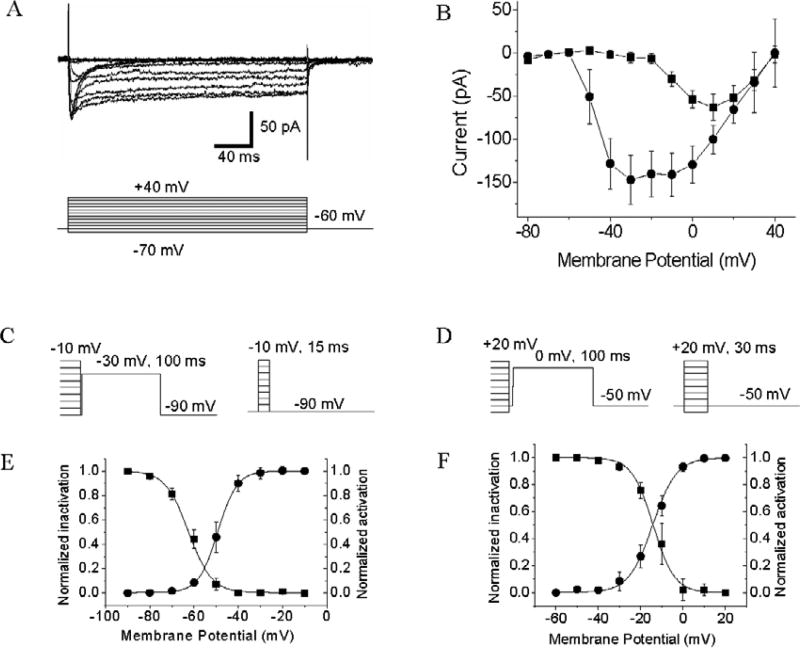
Fig. 2.
LVA and HVA ICa recorded from acutely dissociated GFP-tagged GnRH-containing TN cells. A. Voltage-clamp traces of inward ICa. Voltage steps are shown at the bottom of the current traces. B. Voltage-current (I/V) relationship curves of LVA and HVA ICa generated from data collected at the peak (transient ICa, circles) and at the plateau (sustained ICa, squares). Data represent the means ± SE (n = 12). C, D. Protocols for measuring activation and inactivation voltages of LVA and HVA ICa, respectively. E, F. Voltage-dependent activation (circles) and inactivation (squares) of LVA and HVA ICa. Data represent the means ± SE (n = 12).

