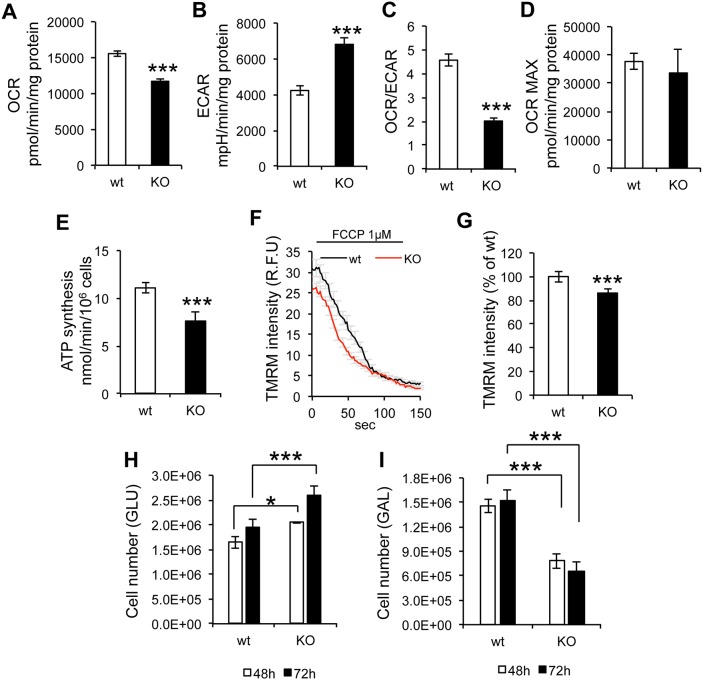
Fig. 2.
Mitochondrial respiration, ATP synthesis and membrane potential are impaired in sAC KO MEFs. (A) Oxygen consumption rate (OCR, n=3). (B) Extracellular acidification rate (ECAR, n=3). (C) OCR/ECAR ratio (n=3). (D) Maximal OCR (n=3). (E) Mitochondrial ATP synthesis (n=6). (F) Trace of TMRM fluorescence in cells, before and after the addition of FCCP (1 µM). (G) TMRM average intensity of KO MEFs expressed as % of wt (n=3, >60 cells measured in each experiment). (H) wt and sAC KO MEFs were seeded at a density of 0.4×10⁶ cells per well and cultured in glucose medium. Cells were counted at 48 and 72 h (n=3). (I) wt and sAC KO MEFs were seeded at a density of 0.4×10⁶ cells per well, and cultured in galactose medium. Cells were counted at 48 and 72 h (n=3). Data are expressed as mean±s.e.m. in indicated number of different biological replicates (*P<0.05, ***P<0.001, Student's t-test).

