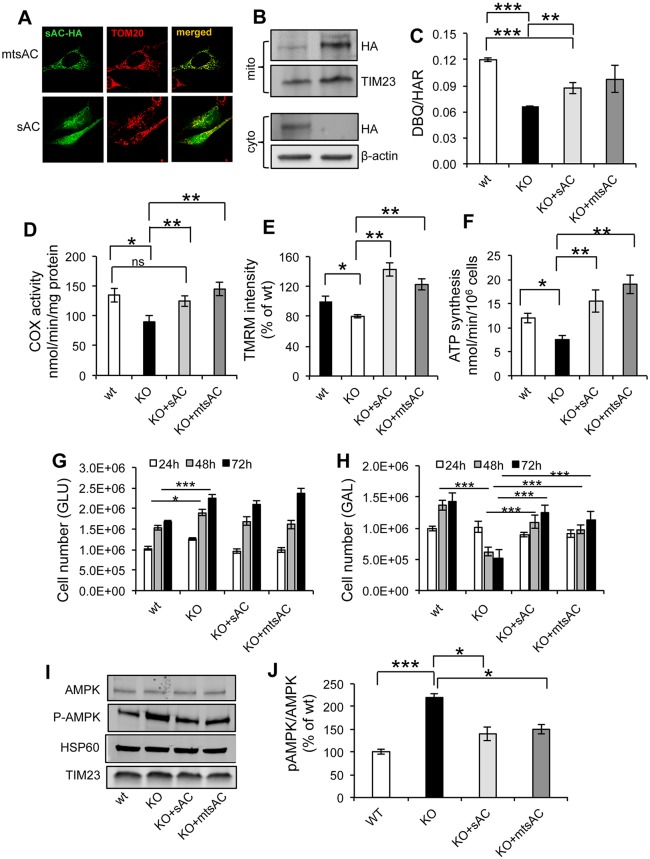
Fig. 4.
Expression of mtsAC and sAC restores mitochondrial bioenergetics in sAC KO cells. (A) Representative images of sAC KO MEFs transfected with HA-tagged mtsAC-HA or HA-tagged sAC-HA and immunostained for HA (green) and TOM20 (red) antibodies. (B) Western blot of total cell homogenate and enriched mitochondrial fractions from KO MEFs transfected with sAC and mtsAC, and immunoblotted for HA, TIM23 and β-actin. (C) DBQ-HAR ratio of complex I activity in wt, KO, KO+sAC and KO+mtsAC (n=3). (D) COX activity in wt, KO, KO+sAC and KO+mtsAC (n=4). (E) TMRM average intensity (expressed as % of KO) in wt, KO, KO+sAC and KO+mtsAC (n=3). (F) ATP synthesis in wt, KO, KO+sAC and KO+mtsAC (n=4). (G) Cell number of wt, KO, KO+sAC and KO+mtsAC MEFs cultured for 24, 48 and 72 h in medium containing glucose. (H) Cell number of wt, KO, KO+sAC and KO+mtsAC cultured in medium containing galactose at 24, 48 and 72 h (n=3). The lines for statistical comparisons encompass both bars representing average values at 48 h and 72 h. (I) Western blot of AMPK, P-AMPK, HSP60, TIM23 in wt, KO, KO+sAC, KO+mtsAC and (J) P-AMPK:AMPK ratio expressed as % of wt (n=4). Data are expressed as mean±s.e.m. in indicated number of different biological replicates (*P<0.05, **P<0.01, ***P<0.001, ANOVA with Tukey's correction).

