Fig. 5.
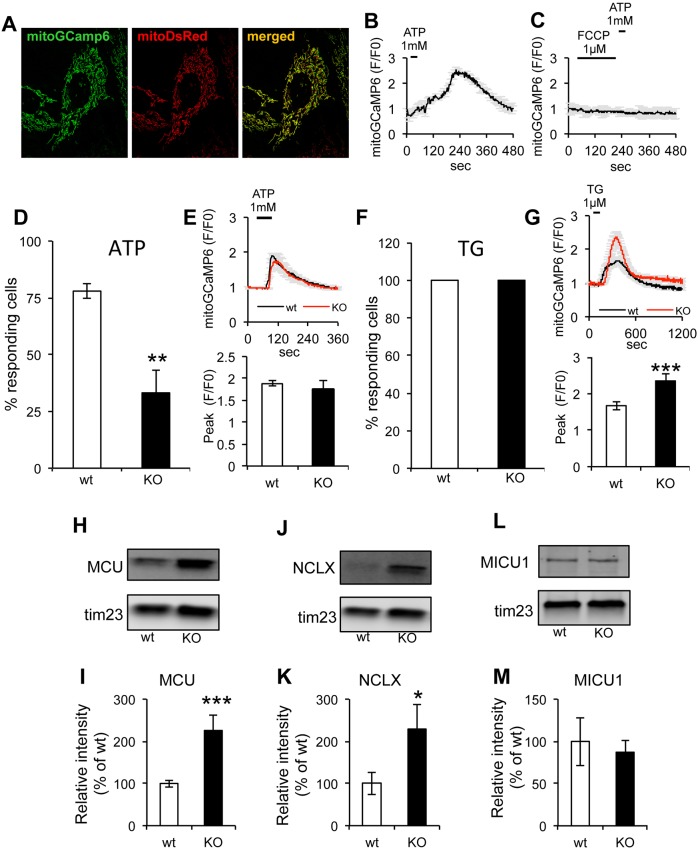
Mitochondrial Ca2+ responses following stimulation of Ca2+ release from the ER is abnormal in sAC KO MEFs. (A) Representative image of wt MEFs co-transfected with mitoGCamp6 and mitoDsRed and merged images. (B) Representative average intensity curve of mitoGCamp6 upon ATP stimulation in wt cells (n=6 cells). (C) Average intensity of mitoGCamp6 in wt cells upon FCCP (first) and ATP (after) addition (n=3 cells). (D) Average percentage of responding wt versus KO cells upon ATP stimulation. (E) Top panel: curves of average mitoGCaMP6 fluorescence in MEFs stimulated with 1 mM ATP (n=14−78 cells, in three independent experiments). Bottom panel: quantification of mitoGCaMP6 fluorescence peak values in responding cells. (F) Percentage of responding cells upon stimulation with TG. (G) Top panel: average curve of mitoGCaMP6 fluorescence in wt and sAC KO MEFs stimulated with 1 µM TG (n=26−37 cells, in three independent experiments). Bottom panel: quantification of mitoGCaMP6 fluorescence peak values in responding wt and sAC KO cells. (H) Western blot of MCU in isolated mitochondria from wt and sAC KO MEFs (n=3) and (I) quantification of the relative intensity normalized on TIM23 and expressed as % of wt. (J,K) Western blot of NCLX in isolated mitochondria from wt and sAC KO MEFs (J) and quantification of the relative intensity normalized on TIM23 and expressed as % of wt (K). (L,M) Western blot of MICU1 in isolated mitochondria of wt and sAC KO cells (n=3) (L), and quantification of the relative intensity normalized on TIM23 and expressed as % of wt (M). Data are expressed as mean±s.e.m. in indicated number of different biological replicates (*P<0.05, **P<0.01, ***P<0.001, Student's t-test).

