Fig. 8.
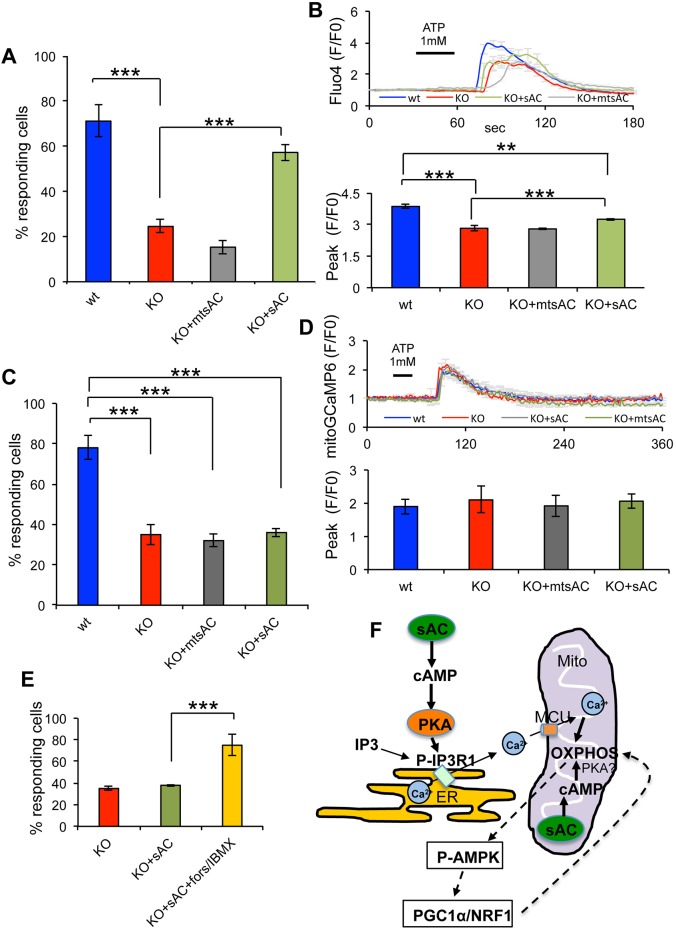
sAC and mtsAC expression restores ER Ca2+ release in sAC KO MEFs. (A) Percentage of cells responding to ATP stimulation in wt, KO, KO+mtsAC and KO+sAC MEFs and loaded with fluo4. (B) Top panel: average fluo4 fluorescence in MEFs stimulated with 1 mM ATP. Bottom panel: quantification of the peak values in responding cells (n=29−52 cells, in three independent experiments). (C) Percentage of cells responding to ATP stimulation in wt, KO, KO+mtsAC and KO+sAC MEFs and loaded with mitoGCaMP6. (D) Top panel: average mitoGCaMP6 fluorescence in MEFs stimulated with 1 mM ATP. Bottom panel: quantification of the peak values in responding cells (n=35−42 cells, in three independent experiments). Data are expressed as mean±s.e.m. in indicated number of different biological replicates (***P<0.001, ANOVA with Tukey's correction). (E) Percentage of cells responding to ATP stimulation in KO, KO+sAC and KO+sAC treated with forskolin/IBMX and loaded with mitoGCaMP6 (n=30−54 cells, in three independent experiments). Data are expressed as mean±s.e.m. in indicated number of different biological replicates (***P<0.001, Student's t-test). (F) Schematic representation of sAC-cAMP domains that regulate ER Ca2+ signaling and OXPHOS: cytosolic sAC produces cytosolic cAMP that leads to PKA-mediated phosphorylation and activation of the IP3R in the ER membrane and increased probability of the open state upon IP3 stimulation. Ca2+ from the ER is taken up by MCU and activates mitochondrial OXPHOS. Mitochondrial sAC regulates OXPHOS in a cAMP-mediated manner, independently of cytosolic sAC. The involvement of PKA as the cAMP-activated kinase in the mitochondrial matrix remains controversial (Valsecchi et al., 2014). OXPHOS regulates the PGC1α/NRF1 signaling pathway through P-AMPK.

