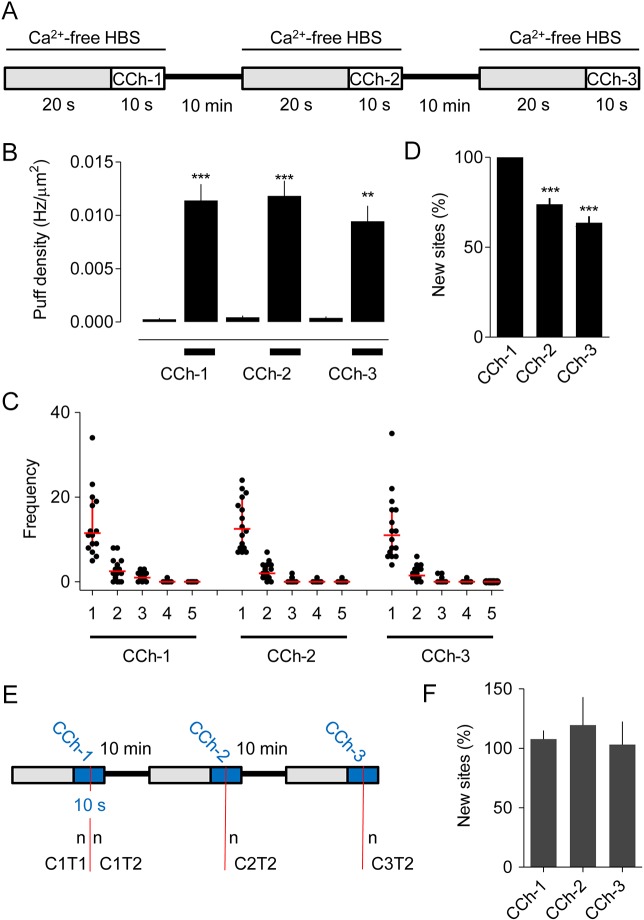
Fig. 3.
Carbachol-evoked Ca2+ puffs initiate at abundant immobile sites. (A) The stimulus regime used for repetitive stimulation of Cal520-loaded HEK293 cells with carbachol (CCh, 10 μM). (B) Results show the density of Ca2+ puffs (Hz/μm2) evoked during each pre-incubation (grey in A) and subsequent stimulation period with CCh. Results (mean± s.e.m.) are from 16 cells. Results for ten individual cells are shown in Fig. S3. ***P<0.001, **P<0.01 relative to pre-incubation values, one-way ANOVA with Bonferroni post hoc test. (C) The number of sites at which 1−5 puffs were detected during the last 2 s after CCh addition for each of the three periods of stimulation. Results show all puffs from 16 cells, with the median and interquartile range shown by horizontal and vertical red lines, respectively. (D) For each cell, the new sites detected during each of three sequential stimulations with CCh are expressed as a percentage of all sites visited during that CCh challenge. Results are means±s.e.m., n=16 cells. ***P<0.001 relative to CCh-1, one-way ANOVA with Bonferroni post hoc test. Table S1 shows the data from which this panel was constructed. (E) Analysis used to determine whether Ca2+ puffs more effectively discover new release sites when the interval between measurements is extended. See text for details. (F) Summary results show the number of new sites discovered during the T2 phase of the response to each of the three stimulations with CCh (CCh1−3) relative to the sites identified during the T1 phase of the first CCh challenge (C1T1). Hence, a site is reported as new if it was not detected during C1T1. Results (means±s.e.m., n=16 cells) are reported as percentages of the number of sites discovered during C1T1.

