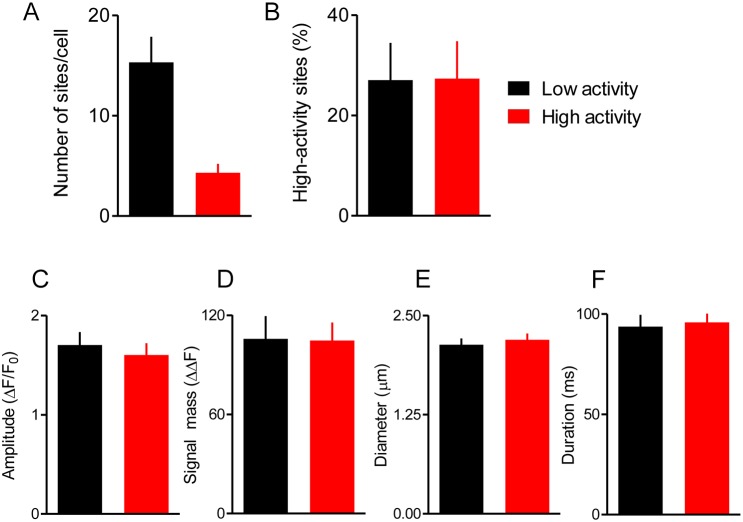
Fig. 4.
Most Ca2+ release sites have similar properties. (A,B) Sites at which Ca2+ puffs occurred during the first challenge with carbachol (Fig. 3A) were categorised as ‘low-activity’ if they responded with a single Ca2+ puff and ‘high-activity’ if they responded with several puffs. Summaries show the numbers of each category of site (A) and the percentage of sites evoking more than one Ca2+ puff during subsequent challenges with carbachol according to whether the sites were categorised as high- or low-activity during the first challenge (B). Results are means±s.e.m. from 16 cells. (C-F) Summary data shows puff amplitudes (C), signal mass (D), puff diameters (E) and durations at half-maximal amplitude (F) for puffs evoked at each category of site. There were no significant differences (paired Student's t-test) in the properties of Ca2+ puffs between low- and high-activity sites. Puff amplitude is defined as the maximum ΔΔF value within the puff region. Signal mass is defined as ΣΔΔF for pixels within the puff region that are ≥T2 (see Materials and Methods). Puff diameters are the average of the major and minor elliptical diameters from the 2D Gaussian fit to the puff region. Results are means±s.e.m. from 16 cells responding to carbachol (10 μM).

