Fig. 6.
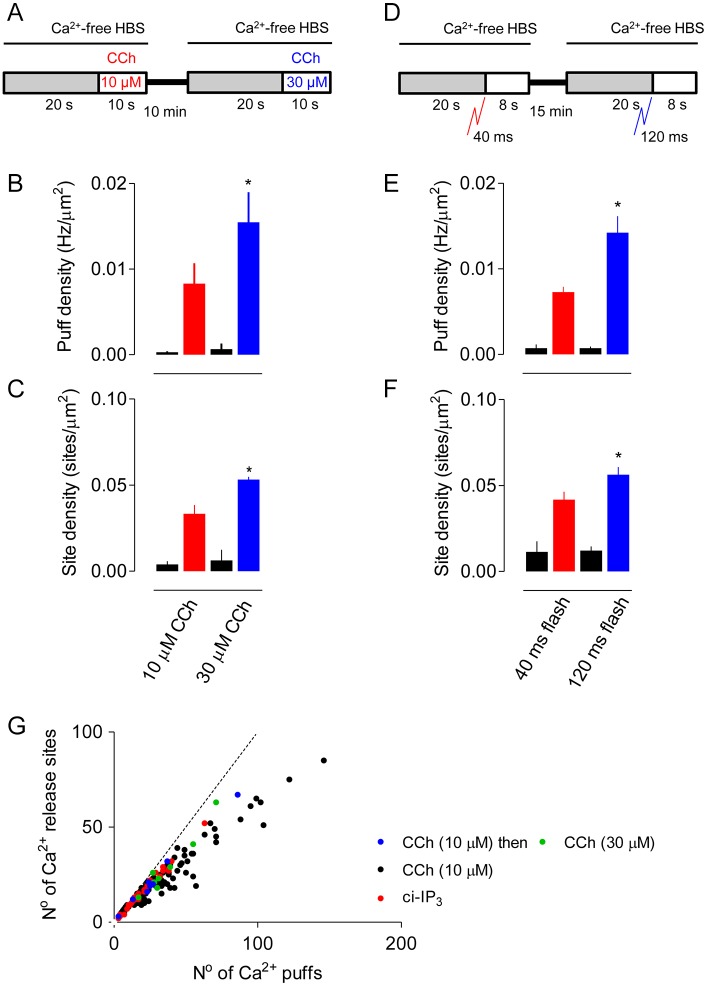
Increasing carbachol concentration increases the frequency of Ca2+ puffs, but not the number of sites. (A) Cells were sequentially stimulated with two concentrations of carbachol (CCh). (B,C) Summary results show the frequency of Ca2+ puffs (B) and the number of sites detected (C) before and after stimulation with the indicated CCh concentrations. Events were recorded for the entire period (up to 10 s) after addition of CCh until the Ca2+ signal propagated across the cell. Results (mean±s.e.m.) are from 8 cells. *P<0.05, paired Student's t-test, relative to first stimulus. (D) Cells were stimulated with two sequential UV flashes to photolyse ci-IP3. (E,F) Summary results show the frequency of Ca2+ puffs (E) and the number of sites detected (F) before and after each stimulation. Results (mean±s.e.m.) are from 10 cells. *P<0.05, paired Student's t-test, relative to first stimulus. (G) Relationship between number of Ca2+ puffs/cell and the unique Ca2+ release sites they identify for cells stimulated once or repetitively with CCh (10 µM, black) or by photolysis of ci-IP3 (40 ms, red). The responses to sequential stimulation with 10 µM (blue) and then 30 µM CCh (green) are shown for 8 cells. The dashed line shows the relationship if every Ca2+ puff identified a new Ca2+ release site.

